Create an Analytics widget for Azure DevOps
Azure DevOps Services | Azure DevOps Server 2022 - Azure DevOps Server 2019
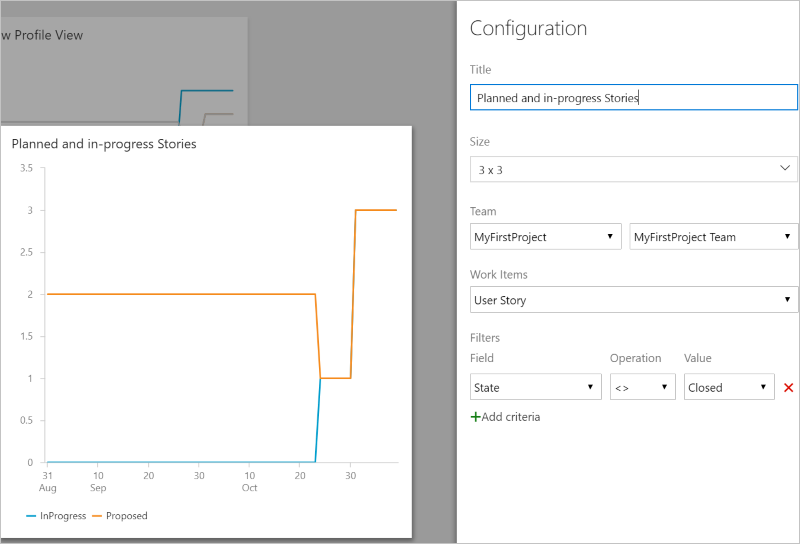
You can build your own Analytics widget to display in a dashboard in Azure DevOps. The example widget on github demonstrates:
- How to render trend lines associated with work item states
- How to query a dataset, whe a user will configure through the widget configuration view
- How to build and publish the widget to the Azure DevOps marketplace
With this information, you'll be able to create your own Analytics widget.

Note
The Analytics service is automatically enabled and supported in production for all Azure DevOps Services. Power BI integration and access to the OData feed of the Analytics Service are generally available. We encourage you to use it and give us feedback.
Available data is version-dependent. The latest supported version is v2.0, and the latest preview version is v4.0-preview. For more information, see OData API versioning.
Note
The Analytics service is automatically installed and supported in production for all new project collections for Azure DevOps Server 2020 and later versions. Power BI integration and access to the OData feed of the Analytics Service are generally available. We encourage you to use it and give us feedback. If you upgraded from Azure DevOps Server 2019, then you can install the Analytics service during upgrade.
Available data is version-dependent. The latest supported version is v2.0, and the latest preview version is v4.0-preview. For more information, see OData API versioning.
Note
The Analytics service is in preview for Azure DevOps Server 2019. You can enable or install it for a project collection. Power BI integration and access to the OData feed of the Analytics Service are in Preview. We encourage you to use it and give us feedback.
Available data is version-dependent. The latest supported version is v2.0, and the latest preview version is v4.0-preview. For more information, see OData API versioning.
Prerequisites
This example provides a ready-made widget, covering basics from topics in Dashboards, Charting, and Analytics. The following documents provide more grounding on details demonstrated in this example:
- Create an Azure DevOps Widget Extension, reference the Widget extensions sample
- Render an Azure DevOps Chart Control, reference Add a Chart
- Query OData from Analytics
Provide a configuration view
- Run simple analytics queries required by UI controls used for configuring a view.
- Manage state of configuration UI, with updates based on user actions, and with new data from Analytics queries.
- Render configuration UI using Typescript and React.
Render data within a Widget
- Run a user configured query as a POST Request
- Interpret data from analytics to render a chart
Next steps
To avoid excess complexity in the sample, we omitted certain technologies and practices, which a production widget should certainly include. The ui-fabric-react sample on github highlights a build process that exercises these details.
- JavaScript bundling and content minification - The set of small, loose script files in the sample can load much more quickly when combined into a single file, and minified.
- Fabric UI Controls - Fabric UI controls provide a rich set of configuration UI components for React.