Troubleshoot issues with advanced diagnostics queries with Azure Cosmos DB for Apache Cassandra
APPLIES TO:
NoSQL
MongoDB
Cassandra
Gremlin
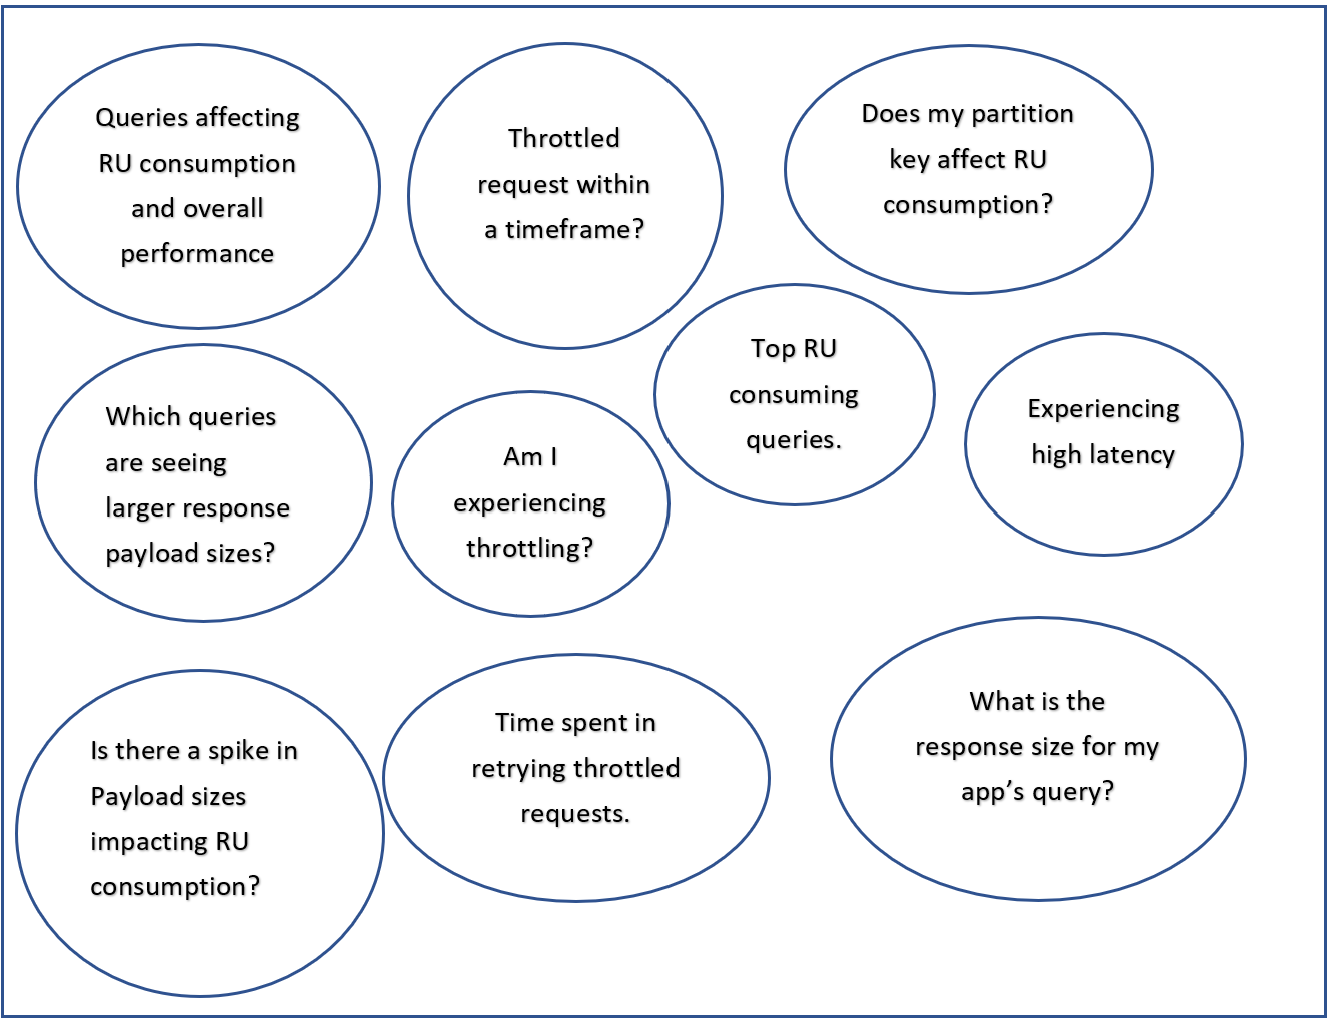
In this article, we'll cover how to write more advanced queries to help troubleshoot issues with your Azure Cosmos DB for Cassandra account by using diagnostics logs sent to resource-specific tables.
For Azure Diagnostics tables, all data is written into one single table. Users specify which category they want to query. If you want to view the full-text query of your request, see Monitor Azure Cosmos DB data by using diagnostic settings in Azure to learn how to enable this feature.
For resource-specific tables, data is written into individual tables for each category of the resource. We recommend this mode because it:
- Makes it much easier to work with the data.
- Provides better discoverability of the schemas.
- Improves performance across both ingestion latency and query times.
Prerequisites
- Create API for Cassandra account
- Create a Log Analytics Workspace.
- Create Diagnostic Settings.
Warning
When creating a Diagnostic Setting for the API for Cassandra account, ensure that "DataPlaneRequests" remain unselected. In addition, for the Destination table, ensure "Resource specific" is chosen as it offers significant cost savings over "Azure diagnostics.
Note
Note that enabling full text diagnostics, the queries returned will contain PII data. This feature will not only log the skeleton of the query with obfuscated parameters but log the values of the parameters themselves. This can help in diagnosing whether queries on a specific Primary Key (or set of Primary Keys) are consuming far more RUs than queries on other Primary Keys.
Log Analytics queries with different scenarios

RU consumption
Cassandra operations that are consuming high RU/s.
CDBCassandraRequests
| where DatabaseName=="azure_comos" and CollectionName=="user"
| project TimeGenerated, RequestCharge, OperationName,
requestType=split(split(PIICommandText,'"')[3], ' ')[0]
| summarize max(RequestCharge) by bin(TimeGenerated, 10m), tostring(requestType), OperationName;
Monitoring RU consumption per operation on logical partition keys.
CDBPartitionKeyRUConsumption
| where DatabaseName=="azure_comos" and CollectionName=="user"
| summarize TotalRequestCharge=sum(todouble(RequestCharge)) by PartitionKey, PartitionKeyRangeId
| order by TotalRequestCharge;

CDBPartitionKeyRUConsumption
| where DatabaseName=="azure_comos" and CollectionName=="user"
| summarize TotalRequestCharge=sum(todouble(RequestCharge)) by OperationName, PartitionKey
| order by TotalRequestCharge;

CDBPartitionKeyRUConsumption
| where DatabaseName=="azure_comos" and CollectionName=="user"
| summarize TotalRequestCharge=sum(todouble(RequestCharge)) by bin(TimeGenerated, 1m), PartitionKey
| render timechart;
What are the top queries impacting RU consumption?
CDBCassandraRequests
| where DatabaseName=="azure_cosmos" and CollectionName=="user"
| where TimeGenerated > ago(24h)
| project ActivityId, DatabaseName, CollectionName, queryText=split(split(PIICommandText,'"')[3], ' ')[0], RequestCharge, TimeGenerated
| order by RequestCharge desc;
RU consumption based on variations in payload sizes for read and write operations.
// This query is looking at read operations
CDBCassandraRequests
| where DatabaseName=="azure_cosmos" and CollectionName=="user"
| project ResponseLength, TimeGenerated, RequestCharge, cassandraOperationName=split(split(PIICommandText,'"')[3], ' ')[0]
| where cassandraOperationName =="SELECT"
| summarize maxResponseLength=max(ResponseLength), maxRU=max(RequestCharge) by bin(TimeGenerated, 10m), tostring(cassandraOperationName)

// This query is looking at write operations
CDBCassandraRequests
| where DatabaseName=="azure_cosmos" and CollectionName=="user"
| project ResponseLength, TimeGenerated, RequestCharge, cassandraOperationName=split(split(PIICommandText,'"')[3], ' ')[0]
| where cassandraOperationName in ("CREATE", "UPDATE", "INSERT", "DELETE", "DROP")
| summarize maxResponseLength=max(ResponseLength), maxRU=max(RequestCharge) by bin(TimeGenerated, 10m), tostring(cassandraOperationName)

// Write operations over a time period.
CDBCassandraRequests
| where DatabaseName=="azure_cosmos" and CollectionName=="user"
| project ResponseLength, TimeGenerated, RequestCharge, cassandraOperationName=split(split(PIICommandText,'"')[3], ' ')[0]
| where cassandraOperationName in ("CREATE", "UPDATE", "INSERT", "DELETE", "DROP")
| summarize maxResponseLength=max(ResponseLength), maxRU=max(RequestCharge) by bin(TimeGenerated, 10m), tostring(cassandraOperationName)
| render timechart;

// Read operations over a time period.
CDBCassandraRequests
| where DatabaseName=="azure_cosmos" and CollectionName=="user"
| project ResponseLength, TimeGenerated, RequestCharge, cassandraOperationName=split(split(PIICommandText,'"')[3], ' ')[0]
| where cassandraOperationName =="SELECT"
| summarize maxResponseLength=max(ResponseLength), maxRU=max(RequestCharge) by bin(TimeGenerated, 10m), tostring(cassandraOperationName)
| render timechart;
RU consumption based on read and write operations by logical partition.
CDBPartitionKeyRUConsumption
| where DatabaseName=="azure_cosmos" and CollectionName=="user"
| where OperationName in ("Delete", "Read", "Upsert")
| summarize totalRU=max(RequestCharge) by OperationName, PartitionKeyRangeId
RU consumption by physical and logical partition.
CDBPartitionKeyRUConsumption
| where DatabaseName=="azure_cosmos" and CollectionName=="user"
| summarize totalRequestCharge=sum(RequestCharge) by PartitionKey, PartitionKeyRangeId;
Is a hot partition leading to high RU consumption?
CDBPartitionKeyStatistics
| where DatabaseName=="azure_cosmos" and CollectionName=="user"
| where  TimeGenerated > now(-8h)
| summarize StorageUsed = sum(SizeKb) by PartitionKey
| order by StorageUsed desc
How does the partition key affect RU consumption?
let storageUtilizationPerPartitionKey =
CDBPartitionKeyStatistics
| project AccountName=tolower(AccountName), PartitionKey, SizeKb;
CDBCassandraRequests
| project AccountName=tolower(AccountName),RequestCharge, ErrorCode, OperationName, ActivityId, DatabaseName, CollectionName, PIICommandText, RegionName
| where DatabaseName=="azure_cosmos" and CollectionName=="user"
| join kind=inner storageUtilizationPerPartitionKey  on $left.AccountName==$right.AccountName
| where ErrorCode != -1 //successful
| project AccountName, PartitionKey,ErrorCode,RequestCharge,SizeKb, OperationName, ActivityId, DatabaseName, CollectionName, PIICommandText, RegionName;
Latency
Number of server-side timeouts (Status Code - 408) seen in the time window.
CDBCassandraRequests
| where DatabaseName=="azure_cosmos" and CollectionName=="user"
| where ErrorCode in (4608, 4352) //Corresponding code in Cassandra
| summarize max(DurationMs) by bin(TimeGenerated, 10m), ErrorCode
| render timechart;
Do we observe spikes in server-side latencies in the specified time window?
CDBCassandraRequests
| where TimeGenerated > now(-6h)
| DatabaseName=="azure_cosmos" and CollectionName=="user"
| summarize max(DurationMs) by bin(TimeGenerated, 10m)
| render timechart;
Operations that are getting throttled.
CDBCassandraRequests
| where DatabaseName=="azure_cosmos" and CollectionName=="user"
| project RequestLength, ResponseLength,
RequestCharge, DurationMs, TimeGenerated, OperationName,
query=split(split(PIICommandText,'"')[3], ' ')[0]
| summarize max(DurationMs) by bin(TimeGenerated, 10m), RequestCharge, tostring(query),
RequestLength, OperationName
| order by RequestLength, RequestCharge;
Throttling
Is your application experiencing any throttling?
CDBCassandraRequests
| where RetriedDueToRateLimiting != false and RateLimitingDelayMs > 0;
What queries are causing your application to throttle with a specified time period looking specifically at 429.
CDBCassandraRequests
| where DatabaseName=="azure_cosmos" and CollectionName=="user"
| where ErrorCode==4097 // Corresponding error code in Cassandra
| project DatabaseName , CollectionName , CassandraCommands=split(split(PIICommandText,'"')[3], ' ')[0] , OperationName, TimeGenerated;
Next steps
- Enable log analytics on your API for Cassandra account.
- Overview error code definition.