System performance counters in Application Insights
Windows provides a variety of performance counters, such as those used to gather processor, memory, and disk usage statistics. You can also define your own performance counters.
Performance counters collection is supported if your application is running under IIS on an on-premises host or is a virtual machine to which you have administrative access. Although applications running as Azure Web Apps don't have direct access to performance counters, a subset of available counters is collected by Application Insights.
Caution
We recommend the Azure Monitor OpenTelemetry Distro for new applications or customers to power Azure Monitor Application Insights. The Azure Monitor OpenTelemetry Distro delivers a similar functionality and experience as the Application Insights SDK. It's possible to migrate from the Application Insights SDK using the migration guides for .NET, Node.js, and Python, but we are still working to add a few more features for backwards compatibility.
Prerequisites
Grant the app pool service account permission to monitor performance counters by adding it to the Performance Monitor Users group.
net localgroup "Performance Monitor Users" /add "IIS APPPOOL\NameOfYourPool"
View counters
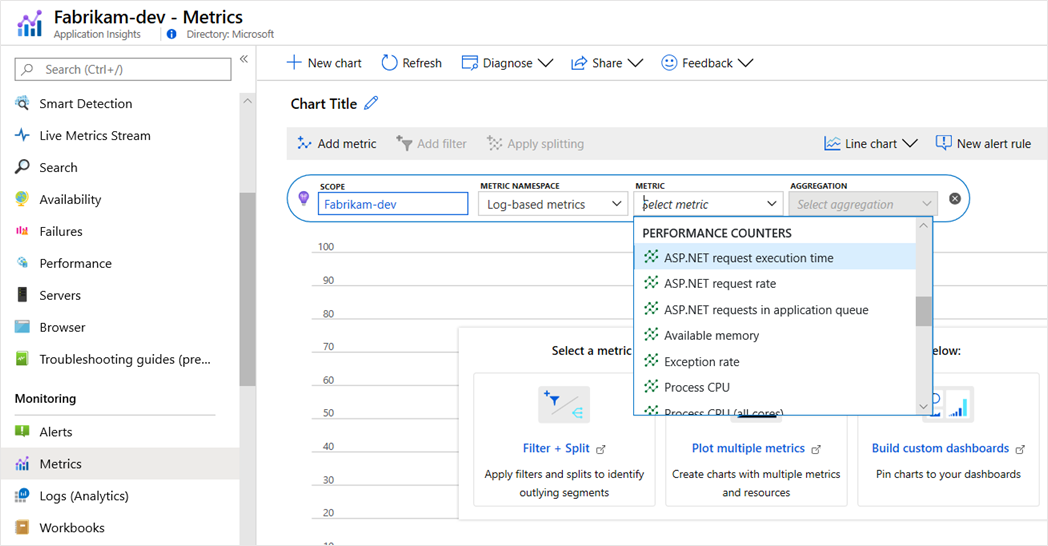
The Metrics pane shows the default set of performance counters.
Current default counters for ASP.NET web applications:
- % Process\Processor Time
- % Process\Processor Time Normalized
- Memory\Available Bytes
- ASP.NET Requests/Sec
- .NET CLR Exceptions Thrown / sec
- ASP.NET ApplicationsRequest Execution Time
- Process\Private Bytes
- Process\IO Data Bytes/sec
- ASP.NET Applications\Requests In Application Queue
- Processor(_Total)\% Processor Time
Current default counters collected for ASP.NET Core web applications:
- % Process\Processor Time
- % Process\Processor Time Normalized
- Memory\Available Bytes
- Process\Private Bytes
- Process\IO Data Bytes/sec
- Processor(_Total)\% Processor Time
Add counters
If the performance counter you want isn't included in the list of metrics, you can add it.
Find out what counters are available in your server by using this PowerShell command on the local server:
Get-Counter -ListSet *For more information, see
Get-Counter.Open
ApplicationInsights.config.If you added Application Insights to your app during development:
- Edit
ApplicationInsights.configin your project. - Redeploy it to your servers.
- Edit
Edit the performance collector directive:
    <Add Type="Microsoft.ApplicationInsights.Extensibility.PerfCounterCollector.PerformanceCollectorModule, Microsoft.AI.PerfCounterCollector">
      <Counters>
        <Add PerformanceCounter="\Objects\Processes"/>
        <Add PerformanceCounter="\Sales(photo)\# Items Sold" ReportAs="Photo sales"/>
      </Counters>
    </Add>
Note
ASP.NET Core applications don't have ApplicationInsights.config, so the preceding method isn't valid for ASP.NET Core applications.
You can capture both standard counters and counters you've implemented yourself. \Objects\Processes is an example of a standard counter that's available on all Windows systems. \Sales(photo)\# Items Sold is an example of a custom counter that might be implemented in a web service.
The format is \Category(instance)\Counter, or for categories that don't have instances, just \Category\Counter.
The ReportAs parameter is required for counter names that don't match [a-zA-Z()/-_ \.]+. That is, they contain characters that aren't in the following sets: letters, round brackets, forward slash, hyphen, underscore, space, and dot.
If you specify an instance, it will be collected as a dimension CounterInstanceName of the reported metric.
Collect performance counters in code for ASP.NET web applications or .NET/.NET Core console applications
To collect system performance counters and send them to Application Insights, you can adapt the following snippet:
    var perfCollectorModule = new PerformanceCollectorModule();
    perfCollectorModule.Counters.Add(new PerformanceCounterCollectionRequest(
      @"\Process([replace-with-application-process-name])\Page Faults/sec", "PageFaultsPerfSec"));
    perfCollectorModule.Initialize(TelemetryConfiguration.Active);
Or you can do the same thing with custom metrics that you created:
    var perfCollectorModule = new PerformanceCollectorModule();
    perfCollectorModule.Counters.Add(new PerformanceCounterCollectionRequest(
      @"\Sales(photo)\# Items Sold", "Photo sales"));
    perfCollectorModule.Initialize(TelemetryConfiguration.Active);
Collect performance counters in code for ASP.NET Core web applications
Configure PerformanceCollectorModule after the WebApplication.CreateBuilder() method in Program.cs:
using Microsoft.ApplicationInsights.Extensibility.PerfCounterCollector;

var builder = WebApplication.CreateBuilder(args);

builder.Services.AddApplicationInsightsTelemetry();

// The following configures PerformanceCollectorModule.

builder.Services.ConfigureTelemetryModule<PerformanceCollectorModule>((module, o) =>
    {
        // The application process name could be "dotnet" for ASP.NET Core self-hosted applications.
        module.Counters.Add(new PerformanceCounterCollectionRequest(@"\Process([replace-with-application-process-name])\Page Faults/sec", "DotnetPageFaultsPerfSec"));
    });

var app = builder.Build();
Performance counters in Log Analytics
You can search and display performance counter reports in Log Analytics.
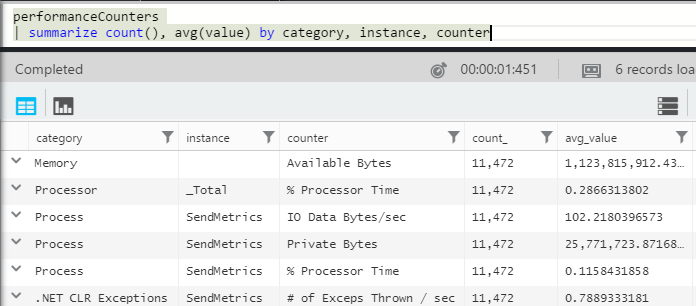
The performanceCounters schema exposes the category, counter name, and instance name of each performance counter. In the telemetry for each application, you'll see only the counters for that application. For example, to see what counters are available:
Here, Instance refers to the performance counter instance, not the role or server machine instance. The performance counter instance name typically segments counters, such as processor time, by the name of the process or application.
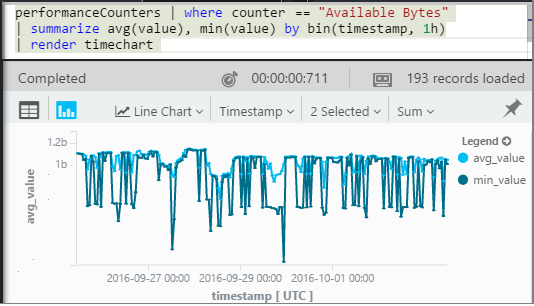
To get a chart of available memory over the recent period:
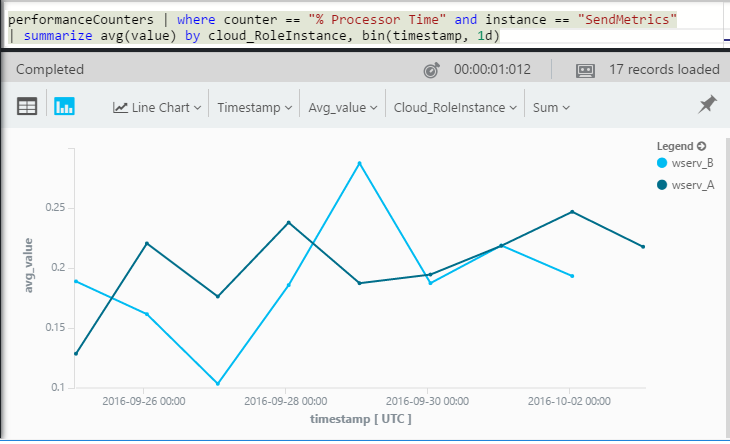
Like other telemetry, performanceCounters also has a column cloud_RoleInstance that indicates the identity of the host server instance on which your app is running. For example, to compare the performance of your app on the different machines:
ASP.NET and Application Insights counts
The next sections discuss ASP.NET and Application Insights counts.
What's the difference between the Exception rate and Exceptions metrics?
Exception rate: The Exception rate is a system performance counter. The CLR counts all the handled and unhandled exceptions that are thrown and divides the total in a sampling interval by the length of the interval. The Application Insights SDK collects this result and sends it to the portal.Exceptions: The Exceptions metric is a count of theTrackExceptionreports received by the portal in the sampling interval of the chart. It includes only the handled exceptions where you've writtenTrackExceptioncalls in your code. It doesn't include all unhandled exceptions.
Performance counters for applications running in Azure Web Apps and Windows containers on Azure App Service
Both ASP.NET and ASP.NET Core applications deployed to Azure Web Apps run in a special sandbox environment. Applications deployed to Azure App Service can utilize a Windows container or be hosted in a sandbox environment. If the application is deployed in a Windows container, all standard performance counters are available in the container image.
The sandbox environment doesn't allow direct access to system performance counters. However, a limited subset of counters is exposed as environment variables as described in Perf Counters exposed as environment variables. Only a subset of counters is available in this environment. For the full list, see Perf Counters exposed as environment variables.
The Application Insights SDK for ASP.NET and ASP.NET Core detects if code is deployed to a web app or a non-Windows container. The detection determines whether it collects performance counters in a sandbox environment or utilizes the standard collection mechanism when hosted on a Windows container or virtual machine.
Performance counters in ASP.NET Core applications
Support for performance counters in ASP.NET Core is limited:
- SDK versions 2.4.1 and later collect performance counters if the application is running in Azure Web Apps (Windows).
- SDK versions 2.7.1 and later collect performance counters if the application is running in Windows and targets
NETSTANDARD2.0or later. - For applications that target the .NET Framework, all versions of the SDK support performance counters.
- SDK versions 2.8.0 and later support the CPU/Memory counter in Linux. No other counter is supported in Linux. To get system counters in Linux (and other non-Windows environments), use EventCounters.
Alerts
Like other metrics, you can set an alert to warn you if a performance counter goes outside a limit you specify. To set an alert, open the Alerts pane and select Add Alert.


