Diagnose exceptions in web apps with Application Insights
Caution
We recommend the Azure Monitor OpenTelemetry Distro for new applications or customers to power Azure Monitor Application Insights. The Azure Monitor OpenTelemetry Distro delivers a similar functionality and experience as the Application Insights SDK. It's possible to migrate from the Application Insights SDK using the migration guides for .NET, Node.js, and Python, but we are still working to add a few more features for backwards compatibility.
Exceptions in web applications can be reported with Application Insights. You can correlate failed requests with exceptions and other events on both the client and server so that you can quickly diagnose the causes. In this article, you'll learn how to set up exception reporting, report exceptions explicitly, diagnose failures, and more.
Set up exception reporting
You can set up Application Insights to report exceptions that occur in either the server or the client. Depending on the platform your application is dependent on, you'll need the appropriate extension or SDK.
Server side
To have exceptions reported from your server-side application, consider the following scenarios:
- Add the Application Insights Extension for Azure web apps.
- Add the Application Monitoring Extension for Azure Virtual Machines and Azure Virtual Machine Scale Sets IIS-hosted apps.
- Install Application Insights SDK in your app code, run Application Insights Agent for IIS web servers, or enable the Java agent for Java web apps.
Client side
The JavaScript SDK provides the ability for client-side reporting of exceptions that occur in web browsers. To set up exception reporting on the client, see Application Insights for webpages.
Application frameworks
With some application frameworks, more configuration is required. Consider the following technologies:
Important
This article is specifically focused on .NET Framework apps from a code example perspective. Some of the methods that work for .NET Framework are obsolete in the .NET Core SDK. For more information, see .NET Core SDK documentation when you build apps with .NET Core.
Diagnose exceptions using Visual Studio
Open the app solution in Visual Studio. Run the app, either on your server or on your development machine by using F5. Re-create the exception.
Open the Application Insights Search telemetry window in Visual Studio. While debugging, select the Application Insights dropdown box.
Select an exception report to show its stack trace. To open the relevant code file, select a line reference in the stack trace.
If CodeLens is enabled, you'll see data about the exceptions:
Diagnose failures using the Azure portal
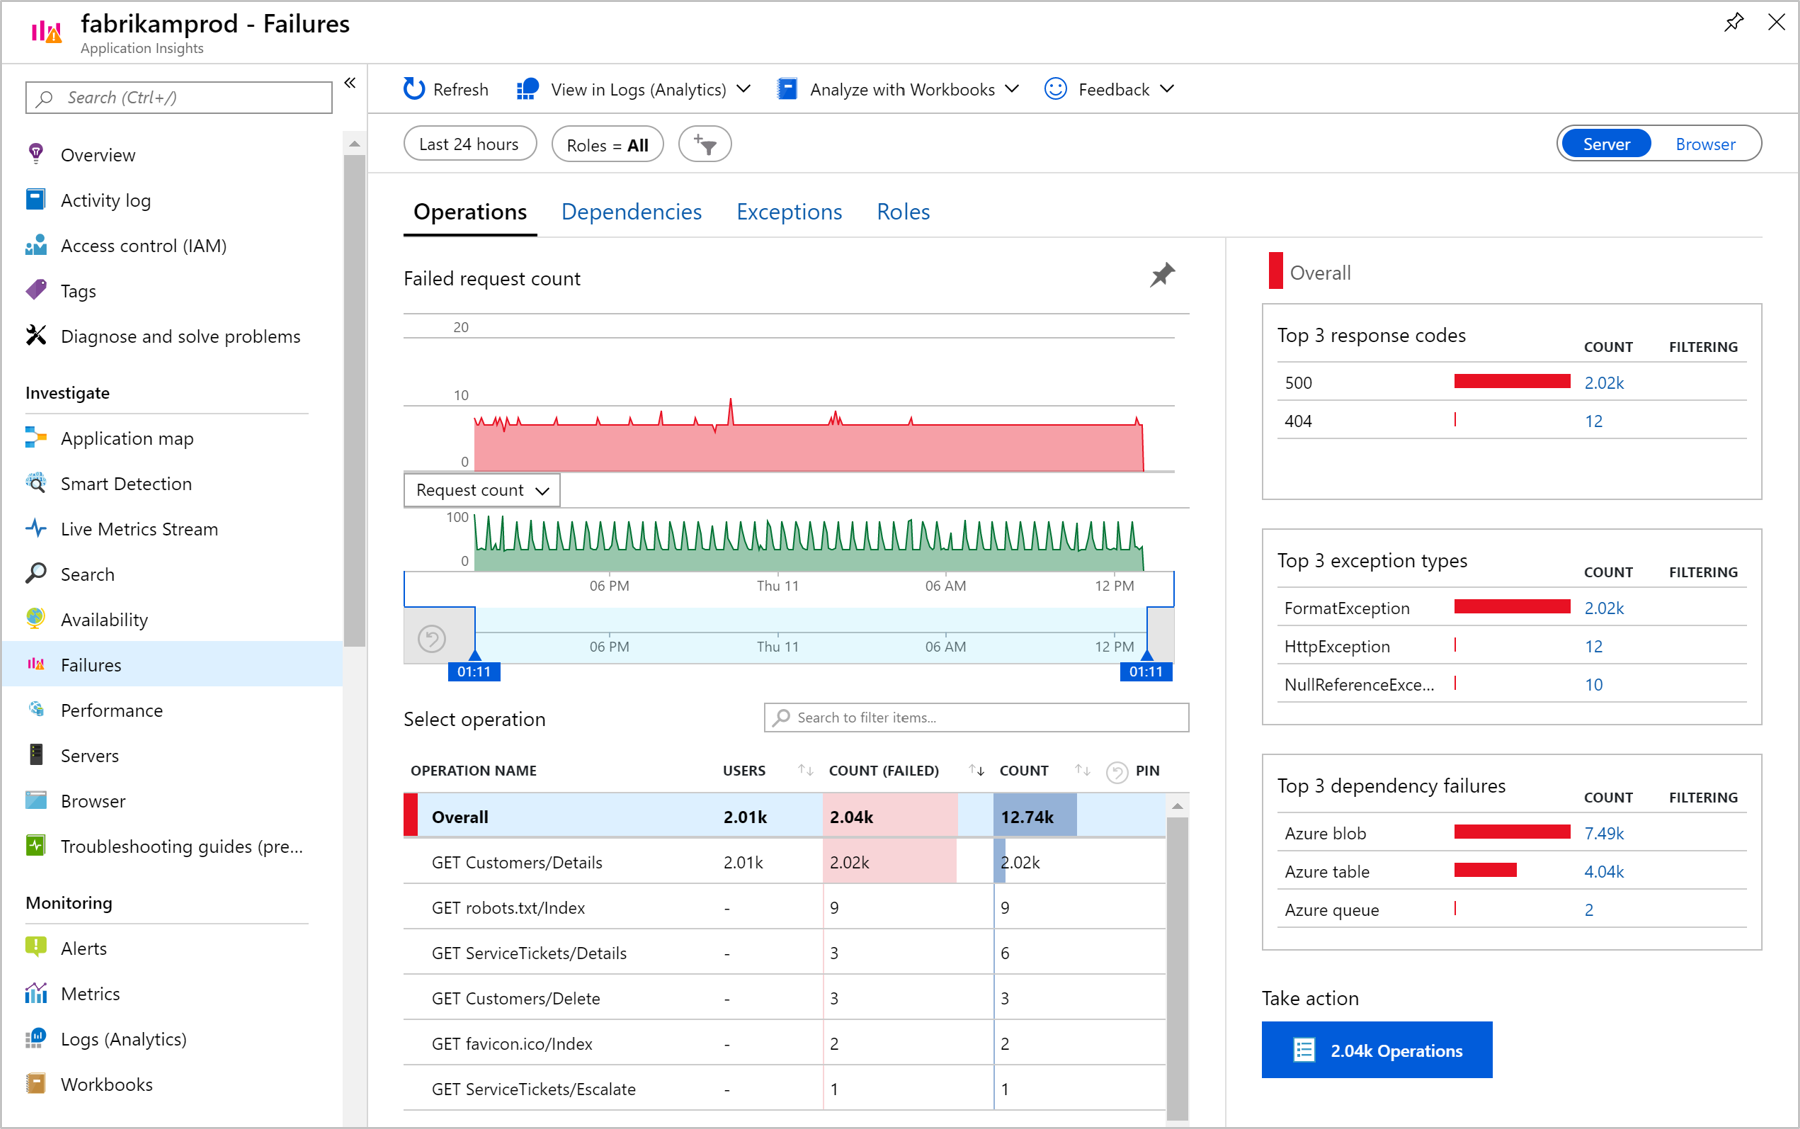
Application Insights comes with a curated Application Performance Management experience to help you diagnose failures in your monitored applications. To start, in the Application Insights resource menu on the left, under Investigate, select the Failures option.
You'll see the failure rate trends for your requests, how many of them are failing, and how many users are affected. The Overall view shows some of the most useful distributions specific to the selected failing operation. You'll see the top three response codes, the top three exception types, and the top three failing dependency types.
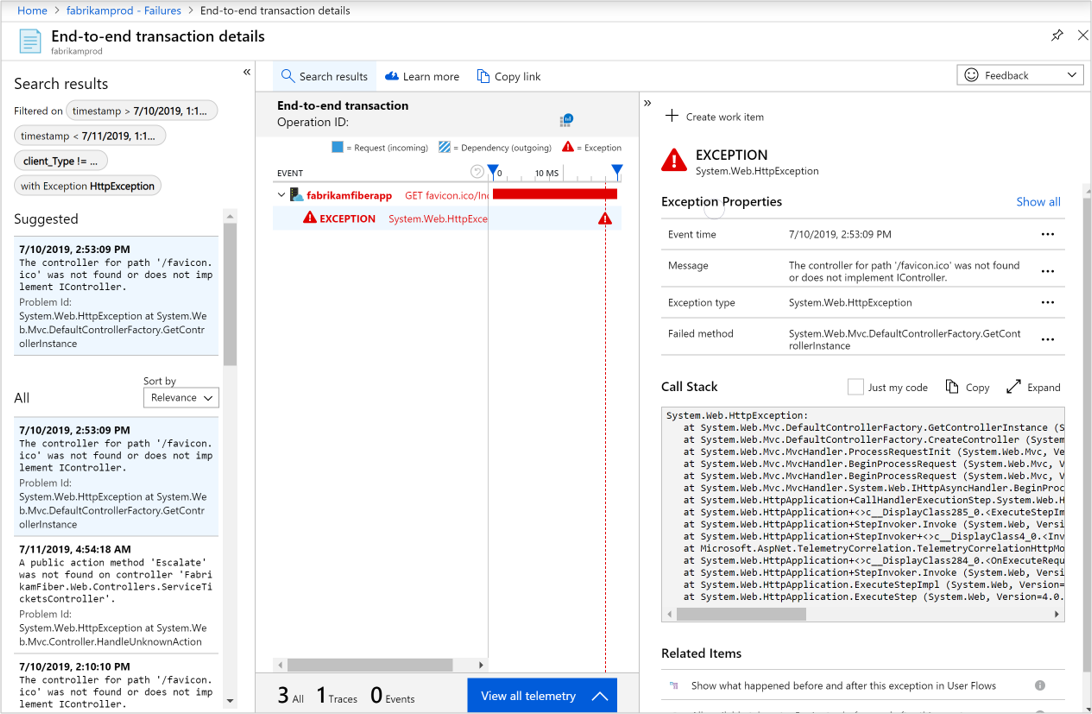
To review representative samples for each of these subsets of operations, select the corresponding link. As an example, to diagnose exceptions, you can select the count of a particular exception to be presented with the End-to-end transaction details tab.
Alternatively, instead of looking at exceptions of a specific failing operation, you can start from the Overall view of exceptions by switching to the Exceptions tab at the top. Here you can see all the exceptions collected for your monitored app.
Custom tracing and log data
To get diagnostic data specific to your app, you can insert code to send your own telemetry data. Your custom telemetry or log data is displayed in diagnostic search alongside the request, page view, and other automatically collected data.
Using the Microsoft.VisualStudio.ApplicationInsights.TelemetryClient, you have several APIs available:
- TelemetryClient.TrackEvent is typically used for monitoring usage patterns, but the data it sends also appears under Custom Events in diagnostic search. Events are named and can carry string properties and numeric metrics on which you can filter your diagnostic searches.
- TelemetryClient.TrackTrace lets you send longer data such as POST information.
- TelemetryClient.TrackException sends exception details, such as stack traces to Application Insights.
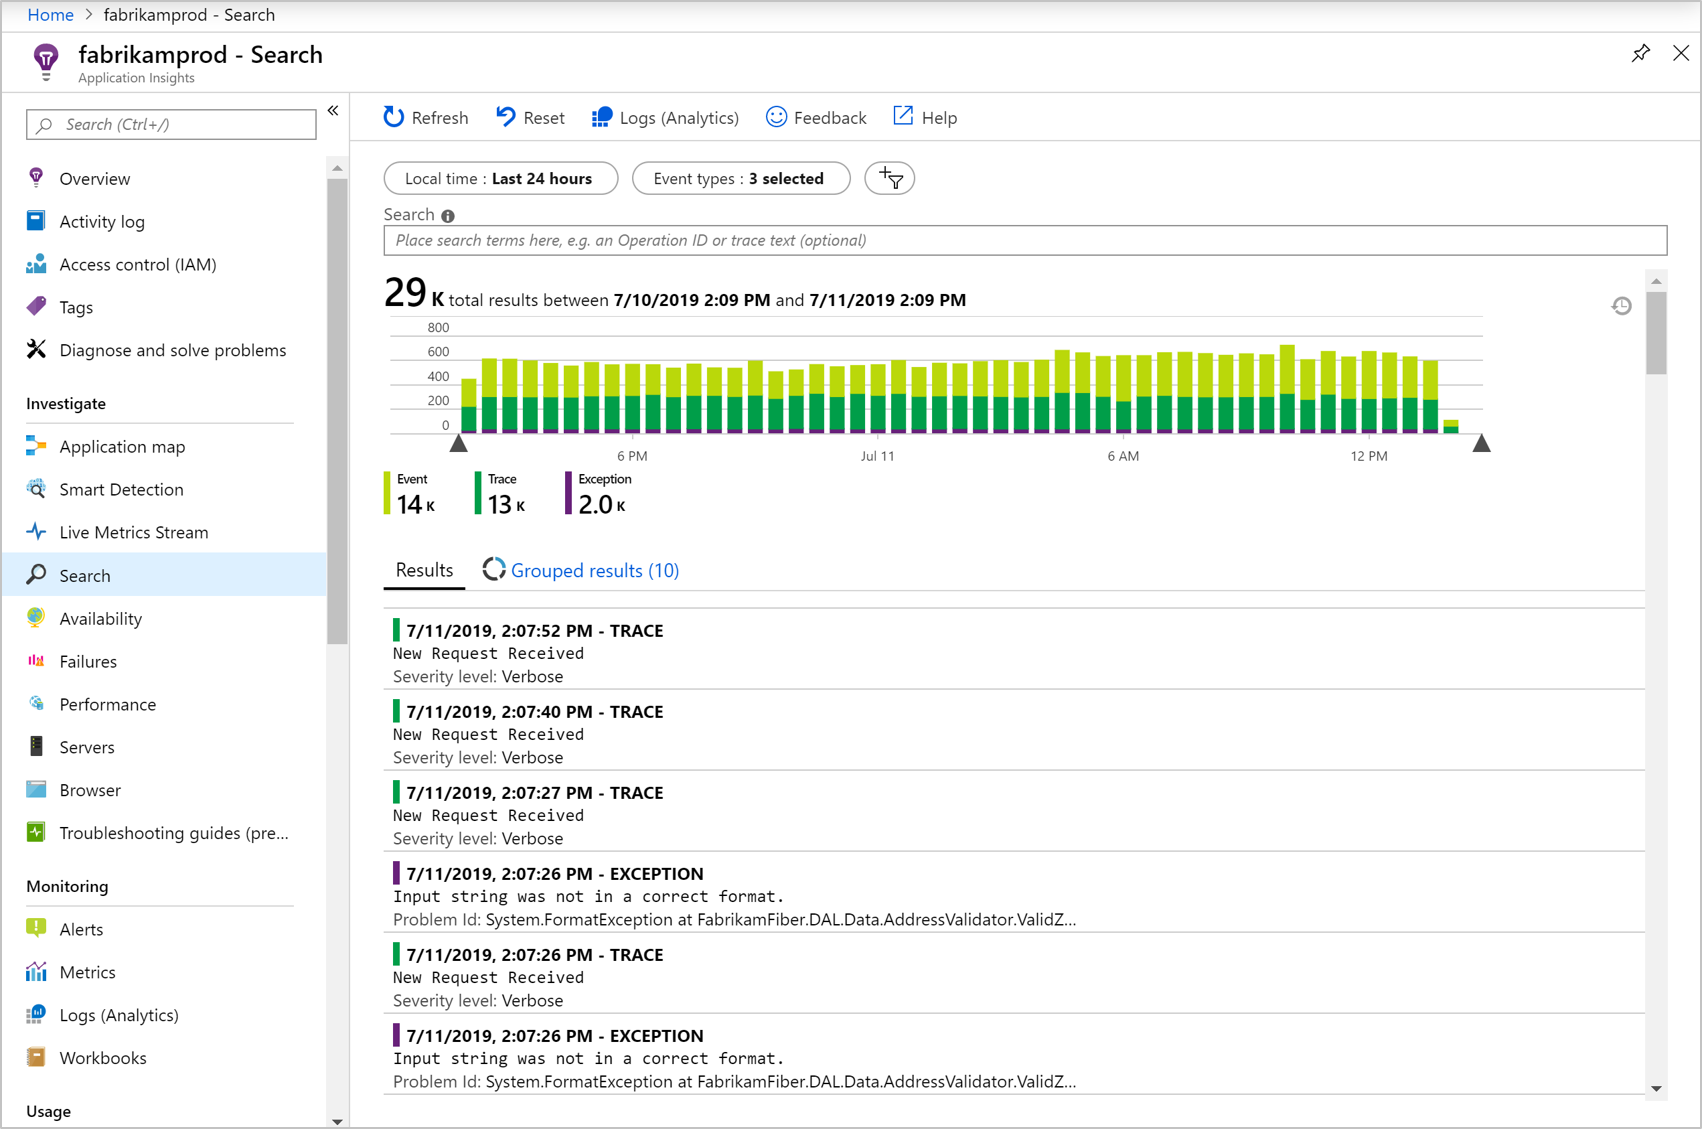
To see these events, on the left menu, open Search. Select the dropdown menu Event types, and then choose Custom Event, Trace, or Exception.
Note
If your app generates a lot of telemetry, the adaptive sampling module will automatically reduce the volume that's sent to the portal by sending only a representative fraction of events. Events that are part of the same operation will be selected or deselected as a group so that you can navigate between related events. For more information, see Sampling in Application Insights.
See request POST data
Request details don't include the data sent to your app in a POST call. To have this data reported:
- Install the SDK in your application project.
- Insert code in your application to call Microsoft.ApplicationInsights.TrackTrace(). Send the POST data in the message parameter. There's a limit to the permitted size, so you should try to send only the essential data.
- When you investigate a failed request, find the associated traces.
Capture exceptions and related diagnostic data
At first, you won't see in the portal all the exceptions that cause failures in your app. You'll see any browser exceptions, if you're using the JavaScript SDK in your webpages. But most server exceptions are caught by IIS and you have to write a bit of code to see them.
You can:
- Log exceptions explicitly by inserting code in exception handlers to report the exceptions.
- Capture exceptions automatically by configuring your ASP.NET framework. The necessary additions are different for different types of framework.
Report exceptions explicitly
The simplest way to report is to insert a call to trackException() in an exception handler.
try
{
    // ...
}
catch (ex)
{
    appInsights.trackException(ex, "handler loc",
    {
        Game: currentGame.Name,
        State: currentGame.State.ToString()
    });
}
var telemetry = new TelemetryClient();

try
{
    // ...
}
catch (Exception ex)
{
    var properties = new Dictionary<string, string>
    {
        ["Game"] = currentGame.Name
    };

    var measurements = new Dictionary<string, double>
    {
        ["Users"] = currentGame.Users.Count
    };

    // Send the exception telemetry:
    telemetry.TrackException(ex, properties, measurements);
}
Dim telemetry = New TelemetryClient

Try
    ' ...
Catch ex as Exception
    ' Set up some properties:
    Dim properties = New Dictionary (Of String, String)
    properties.Add("Game", currentGame.Name)

    Dim measurements = New Dictionary (Of String, Double)
    measurements.Add("Users", currentGame.Users.Count)

    ' Send the exception telemetry:
    telemetry.TrackException(ex, properties, measurements)
End Try
The properties and measurements parameters are optional, but they're useful for filtering and adding extra information. For example, if you have an app that can run several games, you could find all the exception reports related to a particular game. You can add as many items as you want to each dictionary.
Browser exceptions
Most browser exceptions are reported.
If your webpage includes script files from content delivery networks or other domains, ensure your script tag has the attribute crossorigin="anonymous" and that the server sends CORS headers. This behavior will allow you to get a stack trace and detail for unhandled JavaScript exceptions from these resources.
Reuse your telemetry client
Note
We recommend that you instantiate the TelemetryClient once and reuse it throughout the life of an application.
With Dependency Injection (DI) in .NET, the appropriate .NET SDK, and correctly configuring Application Insights for DI, you can require the TelemetryClient as a constructor parameter.
public class ExampleController : ApiController
{
    private readonly TelemetryClient _telemetryClient;

    public ExampleController(TelemetryClient telemetryClient)
    {
        _telemetryClient = telemetryClient;
    }
}
In the preceding example, the TelemetryClient is injected into the ExampleController class.
Web forms
For web forms, the HTTP Module will be able to collect the exceptions when there are no redirects configured with CustomErrors. However, when you have active redirects, add the following lines to the Application_Error function in Global.asax.cs.
void Application_Error(object sender, EventArgs e)
{
    if (HttpContext.Current.IsCustomErrorEnabled &&
        Server.GetLastError () != null)
    {
        _telemetryClient.TrackException(Server.GetLastError());
    }
}
In the preceding example, the _telemetryClient is a class-scoped variable of type TelemetryClient.
MVC
Starting with Application Insights Web SDK version 2.6 (beta 3 and later), Application Insights collects unhandled exceptions thrown in the MVC 5+ controllers methods automatically. If you've previously added a custom handler to track such exceptions, you can remove it to prevent double tracking of exceptions.
There are several scenarios when an exception filter can't correctly handle errors when exceptions are thrown:
- From controller constructors
- From message handlers
- During routing
- During response content serialization
- During application start-up
- In background tasks
All exceptions handled by application still need to be tracked manually. Unhandled exceptions originating from controllers typically result in a 500 "Internal Server Error" response. If such response is manually constructed as a result of a handled exception, or no exception at all, it's tracked in corresponding request telemetry with ResultCode 500. However, the Application Insights SDK is unable to track a corresponding exception.
Prior versions support
If you use MVC 4 (and prior) of Application Insights Web SDK 2.5 (and prior), refer to the following examples to track exceptions.
If the CustomErrors configuration is Off, exceptions will be available for the HTTP Module to collect. However, if it's RemoteOnly (default), or On, the exception will be cleared and not available for Application Insights to automatically collect. You can fix that behavior by overriding the System.Web.Mvc.HandleErrorAttribute class and applying the overridden class as shown for the different MVC versions here (see the GitHub source):
using System;
using System.Web.Mvc;
using Microsoft.ApplicationInsights;

namespace MVC2App.Controllers
{
    [AttributeUsage(AttributeTargets.Class | AttributeTargets.Method, Inherited = true, AllowMultiple = true)]
    public class AiHandleErrorAttribute : HandleErrorAttribute
    {
        public override void OnException(ExceptionContext filterContext)
        {
            if (filterContext != null && filterContext.HttpContext != null && filterContext.Exception != null)
            {
                //The attribute should track exceptions only when CustomErrors setting is On
                //if CustomErrors is Off, exceptions will be caught by AI HTTP Module
                if (filterContext.HttpContext.IsCustomErrorEnabled)
                {   //Or reuse instance (recommended!). See note above.
                    var ai = new TelemetryClient();
                    ai.TrackException(filterContext.Exception);
                }
            }
            base.OnException(filterContext);
        }
    }
}
MVC 2
Replace the HandleError attribute with your new attribute in your controllers:
    namespace MVC2App.Controllers
    {
        [AiHandleError]
        public class HomeController : Controller
        {
            // Omitted for brevity
        }
    }
MVC 3
Register AiHandleErrorAttribute as a global filter in Global.asax.cs:
public class MyMvcApplication : System.Web.HttpApplication
{
    public static void RegisterGlobalFilters(GlobalFilterCollection filters)
    {
        filters.Add(new AiHandleErrorAttribute());
    }
}
MVC 4, MVC 5
Register AiHandleErrorAttribute as a global filter in FilterConfig.cs:
public class FilterConfig
{
    public static void RegisterGlobalFilters(GlobalFilterCollection filters)
    {
        // Default replaced with the override to track unhandled exceptions
        filters.Add(new AiHandleErrorAttribute());
    }
}
Web API
Starting with Application Insights Web SDK version 2.6 (beta 3 and later), Application Insights collects unhandled exceptions thrown in the controller methods automatically for Web API 2+. If you've previously added a custom handler to track such exceptions, as described in the following examples, you can remove it to prevent double tracking of exceptions.
There are several cases that the exception filters can't handle. For example:
- Exceptions thrown from controller constructors.
- Exceptions thrown from message handlers.
- Exceptions thrown during routing.
- Exceptions thrown during response content serialization.
- Exception thrown during application startup.
- Exception thrown in background tasks.
All exceptions handled by application still need to be tracked manually. Unhandled exceptions originating from controllers typically result in a 500 "Internal Server Error" response. If such a response is manually constructed as a result of a handled exception, or no exception at all, it's tracked in a corresponding request telemetry with ResultCode 500. However, the Application Insights SDK can't track a corresponding exception.
Prior versions support
If you use Web API 1 (and earlier) of Application Insights Web SDK 2.5 (and earlier), refer to the following examples to track exceptions.
Web API 1.x
Override System.Web.Http.Filters.ExceptionFilterAttribute:
using System.Web.Http.Filters;
using Microsoft.ApplicationInsights;

namespace WebAPI.App_Start
{
    public class AiExceptionFilterAttribute : ExceptionFilterAttribute
    {
    public override void OnException(HttpActionExecutedContext actionExecutedContext)
    {
        if (actionExecutedContext != null && actionExecutedContext.Exception != null)
        {  //Or reuse instance (recommended!). See note above.
            var ai = new TelemetryClient();
            ai.TrackException(actionExecutedContext.Exception);
        }
        base.OnException(actionExecutedContext);
    }
    }
}
You could add this overridden attribute to specific controllers, or add it to the global filter configuration in the WebApiConfig class:
using System.Web.Http;
using WebApi1.x.App_Start;

namespace WebApi1.x
{
    public static class WebApiConfig
    {
        public static void Register(HttpConfiguration config)
        {
            config.Routes.MapHttpRoute(
                name: "DefaultApi",
                routeTemplate: "api/{controller}/{id}",
                defaults: new { id = RouteParameter.Optional });

            // ...
            config.EnableSystemDiagnosticsTracing();

            // Capture exceptions for Application Insights:
            config.Filters.Add(new AiExceptionFilterAttribute());
        }
    }
}
Web API 2.x
Add an implementation of IExceptionLogger:
using System.Web.Http.ExceptionHandling;
using Microsoft.ApplicationInsights;

namespace ProductsAppPureWebAPI.App_Start
{
    public class AiExceptionLogger : ExceptionLogger
    {
        public override void Log(ExceptionLoggerContext context)
        {
            if (context != null && context.Exception != null)
            {
                //or reuse instance (recommended!). see note above
                var ai = new TelemetryClient();
                ai.TrackException(context.Exception);
            }
            base.Log(context);
        }
    }
}
Add this snippet to the services in WebApiConfig:
using System.Web.Http;
using System.Web.Http.ExceptionHandling;
using ProductsAppPureWebAPI.App_Start;

namespace WebApi2WithMVC
{
    public static class WebApiConfig
    {
        public static void Register(HttpConfiguration config)
        {
            // Web API configuration and services

            // Web API routes
            config.MapHttpAttributeRoutes();

            config.Routes.MapHttpRoute(
                name: "DefaultApi",
                routeTemplate: "api/{controller}/{id}",
                defaults: new { id = RouteParameter.Optional });

            config.Services.Add(typeof(IExceptionLogger), new AiExceptionLogger());
        }
    }
}
As alternatives, you could:
- Replace the only
ExceptionHandlerinstance with a custom implementation ofIExceptionHandler. This exception handler is only called when the framework is still able to choose which response message to send, not when the connection is aborted, for instance. - Use exception filters, as described in the preceding section on Web API 1.x controllers, which aren't called in all cases.
WCF
Add a class that extends Attribute and implements IErrorHandler and IServiceBehavior.
    using System;
    using System.Collections.Generic;
    using System.Linq;
    using System.ServiceModel.Description;
    using System.ServiceModel.Dispatcher;
    using System.Web;
    using Microsoft.ApplicationInsights;

    namespace WcfService4.ErrorHandling
    {
      public class AiLogExceptionAttribute : Attribute, IErrorHandler, IServiceBehavior
      {
        public void AddBindingParameters(ServiceDescription serviceDescription,
            System.ServiceModel.ServiceHostBase serviceHostBase,
            System.Collections.ObjectModel.Collection<ServiceEndpoint> endpoints,
            System.ServiceModel.Channels.BindingParameterCollection bindingParameters)
        {
        }

        public void ApplyDispatchBehavior(ServiceDescription serviceDescription,
            System.ServiceModel.ServiceHostBase serviceHostBase)
        {
            foreach (ChannelDispatcher disp in serviceHostBase.ChannelDispatchers)
            {
                disp.ErrorHandlers.Add(this);
            }
        }

        public void Validate(ServiceDescription serviceDescription,
            System.ServiceModel.ServiceHostBase serviceHostBase)
        {
        }

        bool IErrorHandler.HandleError(Exception error)
        {//or reuse instance (recommended!). see note above
            var ai = new TelemetryClient();

            ai.TrackException(error);
            return false;
        }

        void IErrorHandler.ProvideFault(Exception error,
            System.ServiceModel.Channels.MessageVersion version,
            ref System.ServiceModel.Channels.Message fault)
        {
        }
      }
    }
Add the attribute to the service implementations:
namespace WcfService4
{
    [AiLogException]
    public class Service1 : IService1
    {
        // Omitted for brevity
    }
}
Exception performance counters
If you've installed the Azure Monitor Application Insights Agent on your server, you can get a chart of the exceptions rate, measured by .NET. Both handled and unhandled .NET exceptions are included.
Open a metrics explorer tab, add a new chart. Under Performance Counters, select Exception rate.
The .NET Framework calculates the rate by counting the number of exceptions in an interval and dividing by the length of the interval.
This count is different from the Exceptions count calculated by the Application Insights portal counting TrackException reports. The sampling intervals are different, and the SDK doesn't send TrackException reports for all handled and unhandled exceptions.


