URL Monitoring Part III – The Monitors
This entry is part of the following series:
URL Monitoring Part I – The Design
URL Monitoring Part II – The Classes and Discoveries
URL Monitoring Part III – The Monitors
URL Monitoring Part IV – Getting More Advanced
URL Monitoring Part V – Monitoring URLs from a Resource Pool
Creating the monitors was by far the most complex part of this solution because monitors do not use data sources directly. Instead, they use Monitor Types which in turn use data sources. This is because data sources don’t understand the difference between what is considered healthy and what isn’t.
Again, I will use the System Center Configuration Manager Management Point monitor for this example since the other scenarios are built in the same way.
Step 1 – Creating the web page up/down data source. This custom data source is generic and can be used for any URL but its primary function is to return whether or not a web page returns with or without error.
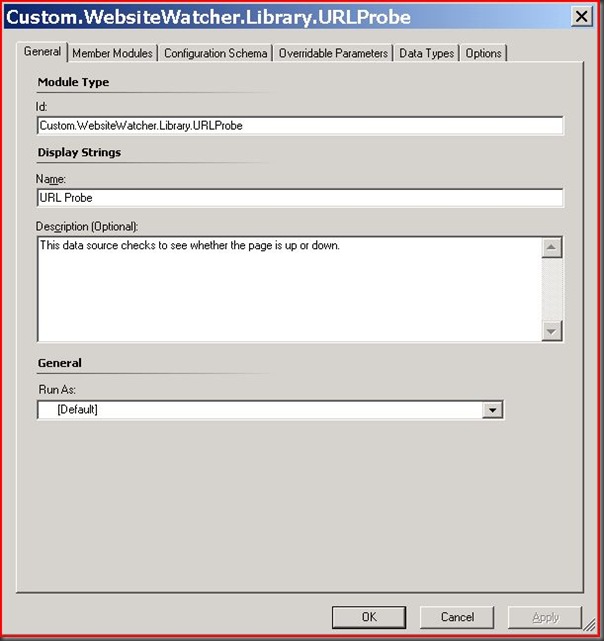
I use the System.Scheduler and Microsoft.SystemCenter.WebApplication.UrlProbe modules so this MP does take a dependency on the Web Application Library MP. Make sure this is added as a reference under File\Management Pack Properties before continuing.
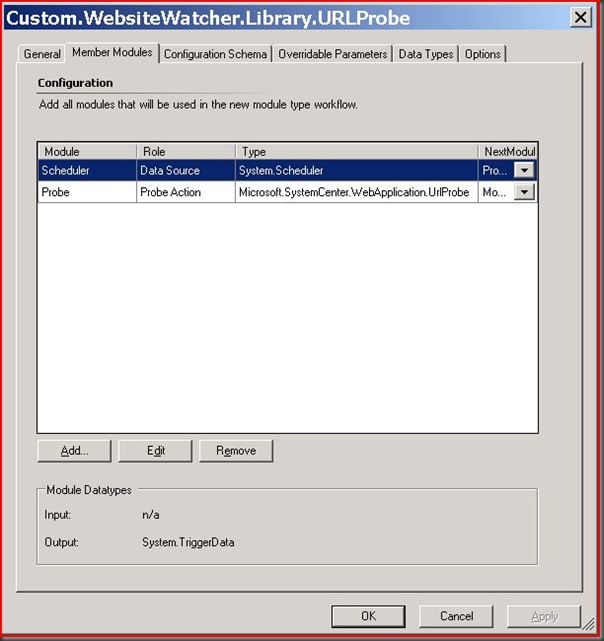
The System.Scheduler module is used for kicking off the URL Probe on a dynamic interval which in my example ends up being every 15 seconds. This is a parameter that is passed at the monitor level.
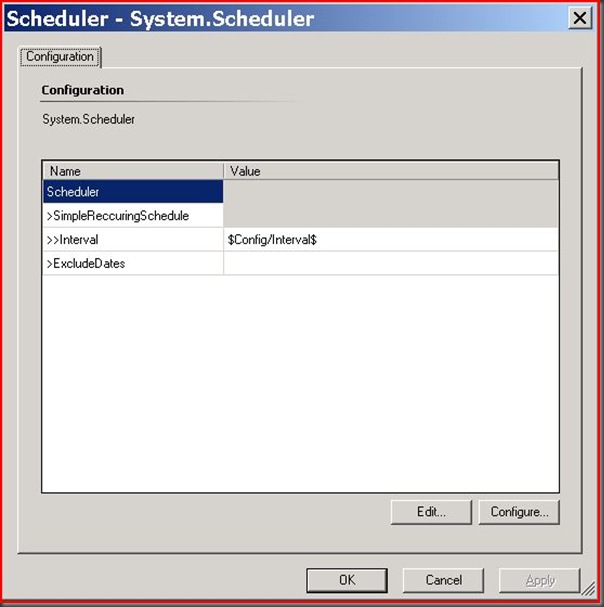
The Microsoft.SystemCenter.WebApplication.URLProbe module is very complex so I pasted the configuration below:
<ProbeAction ID="Probe" TypeID="MicrosoftSystemCenterWebApplicationLibrary!Microsoft.SystemCenter.WebApplication.UrlProbe">
<Proxy />
<ProxyUserName />
<ProxyPassword />
<ProxyAuthenticationScheme>None</ProxyAuthenticationScheme>
<CredentialUserName />
<CredentialPassword />
<AuthenticationScheme>None</AuthenticationScheme>
<FollowRedirects>true</FollowRedirects>
<RetryCount>0</RetryCount>
<RequestTimeout>0</RequestTimeout>
<Requests>
<Request>
<RequestID>1</RequestID>
<URL>$Config/URLPath$</URL>
<Verb>GET</Verb>
<Version>HTTP/1.1</Version>
<HttpHeaders>
<HttpHeader>
<Name>User-Agent</Name>
<Value>Mozilla/4.0 (compatible; MSIE 6.0; Windows NT 5.1)</Value>
</HttpHeader>
</HttpHeaders>
<Body />
<CheckContentChange>false</CheckContentChange>
<ContentHash>00000000-0000-0000-0000-000000000000</ContentHash>
<Depth>0</Depth>
<ThinkTime>0</ThinkTime>
<CheckInternalLinks>false</CheckInternalLinks>
<CheckExternalLinks>false</CheckExternalLinks>
<CheckResources>false</CheckResources>
<RequestEvaluationCriteria>
<StopProcessingIfWarningCriteriaIsMet>false</StopProcessingIfWarningCriteriaIsMet>
<StopProcessingIfErrorCriteriaIsMet>false</StopProcessingIfErrorCriteriaIsMet>
<BasePageEvaluationCriteria>
<WarningCriteria />
<ErrorCriteria>
<NumericCriteriaExpressions>
<NumericCriteriaExpression>
<NumericRequestMetric>BasePageData/TotalResponseTime</NumericRequestMetric>
<Operator>Greater</Operator>
<Value>$Config/ResponseTime$</Value>
</NumericCriteriaExpression>
</NumericCriteriaExpressions>
</ErrorCriteria>
</BasePageEvaluationCriteria>
<LinksEvaluationCriteria>
<WarningCriteria>
<StatusCodeCriteria>
<ListNumericRequestMetric>StatusCode</ListNumericRequestMetric>
<Operator>GreaterEqual</Operator>
<Value>400</Value>
</StatusCodeCriteria>
</WarningCriteria>
<ErrorCriteria />
</LinksEvaluationCriteria>
<ResourcesEvaluationCriteria>
<WarningCriteria>
<StatusCodeCriteria>
<ListNumericRequestMetric>StatusCode</ListNumericRequestMetric>
<Operator>GreaterEqual</Operator>
<Value>400</Value>
</StatusCodeCriteria>
</WarningCriteria>
<ErrorCriteria />
</ResourcesEvaluationCriteria>
<WebPageTotalEvaluationCriteria>
<WarningCriteria />
<ErrorCriteria />
</WebPageTotalEvaluationCriteria>
<DepthEvaluationCriteria>
<WarningCriteria />
<ErrorCriteria />
</DepthEvaluationCriteria>
</RequestEvaluationCriteria>
<FormsAuthCredentials />
</Request>
</Requests>
</ProbeAction>
This is passed to another data source in the Web Application Library which uses internal libraries to do the actual HTTP request.
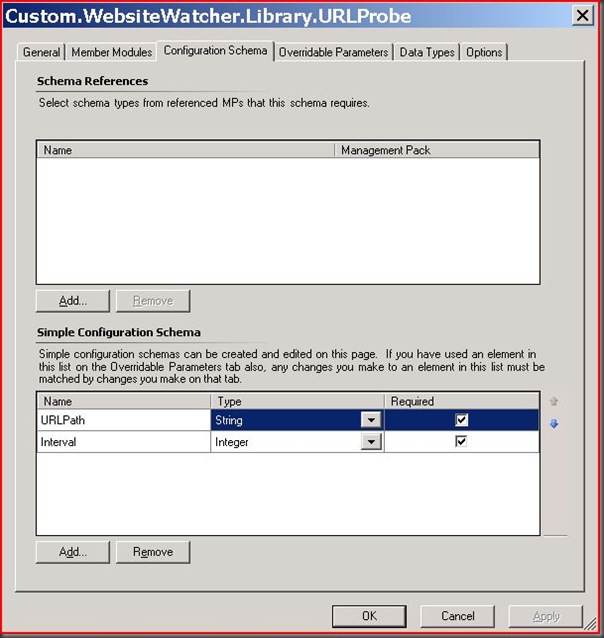
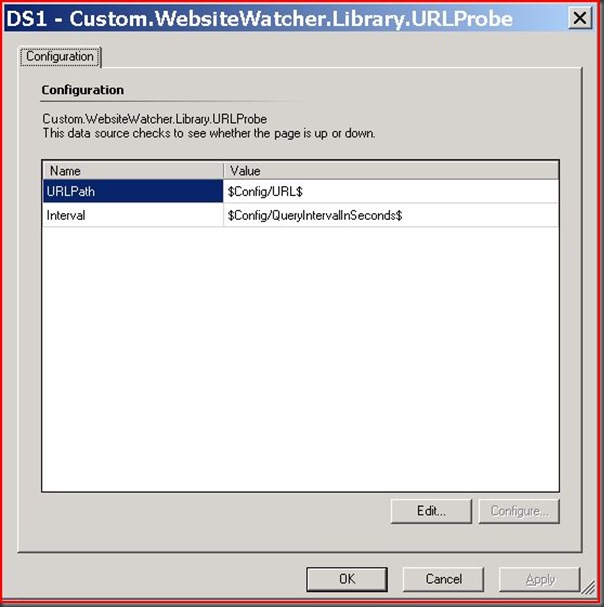
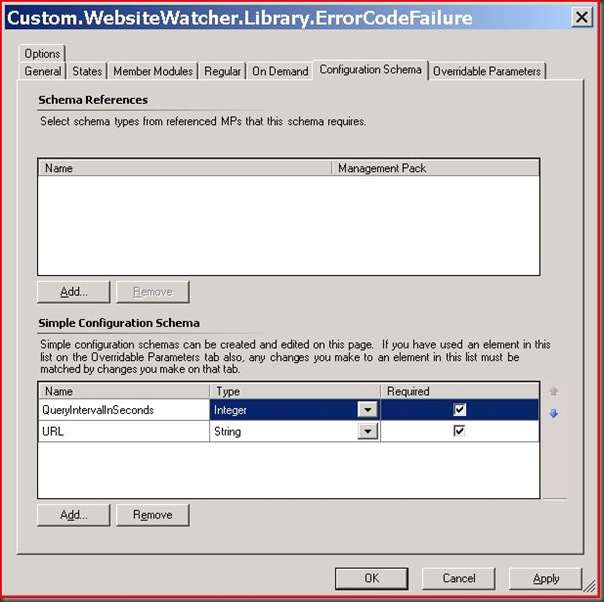
The Configuration Schema tab contains the parameters which are passed to this data source. Currently it only accepts the URL and the interval at which the URL is to be watched.
This Data Source should output WebApplicationData.
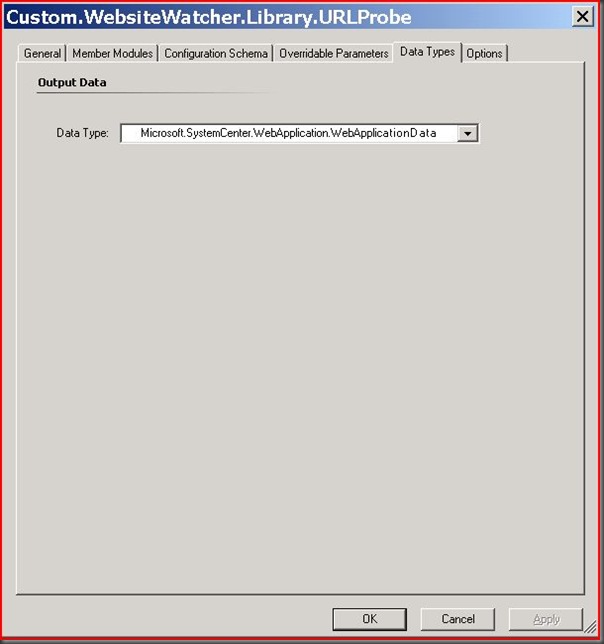
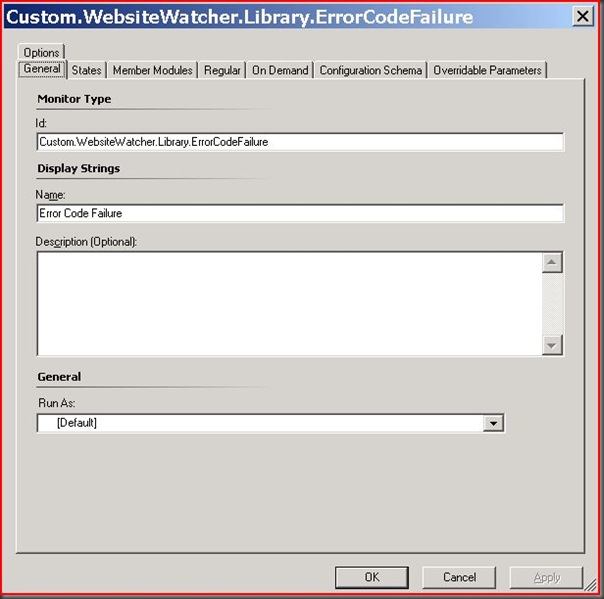
Step 2 – Creating the Monitor Type. The Monitor Type takes parameters from the Monitor and passes them onto the data source. It also evaluates the data source to help the monitor determine what criteria equals healthy versus unhealthy.
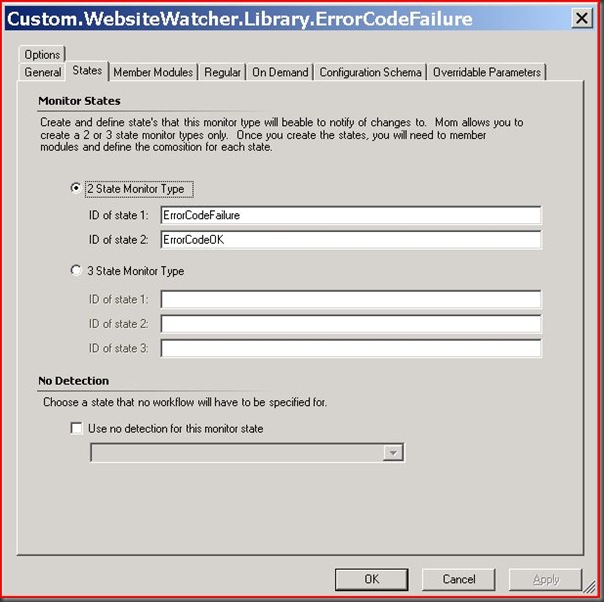
For States just enter something that makes sense for the type of monitor you will be using.
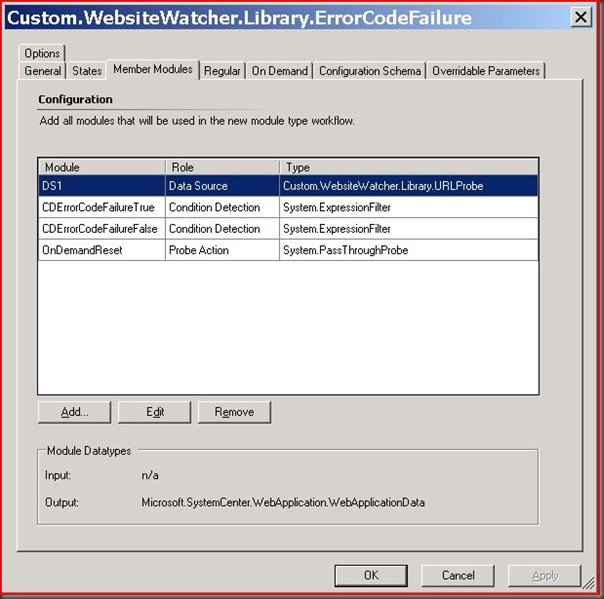
The Member Modules start with the data source we just created. The Condition Detections are used to evaluate the results of the data source and the Probe Action is used to recalculate the state of the monitor manually.
The configuration of the data source module is fairly simple in that we are accepting parameters from the monitor (which we haven’t created yet) and are just re-passing them to the data source.
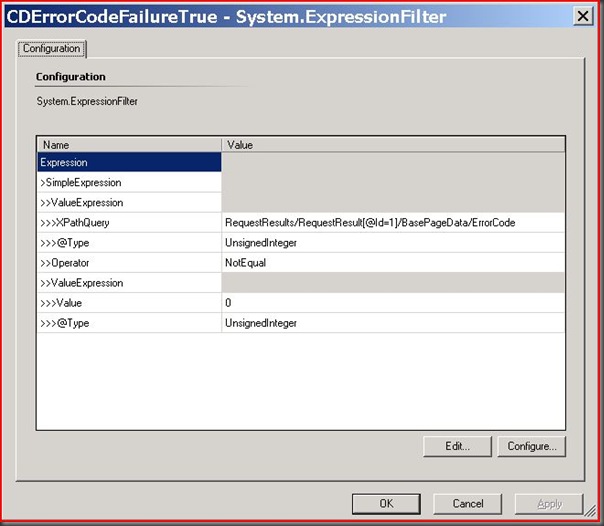
The first expression filter evaluates the web page as down.
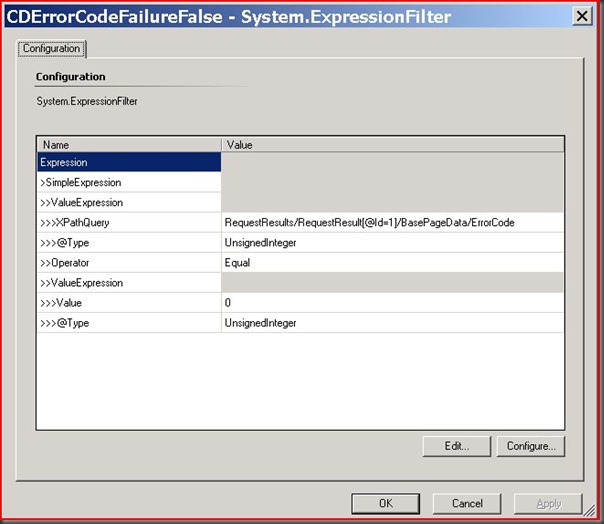
The second expression filter evaluates the web page as up.
The OnDemandReset Probe Action does not contain any custom configuration information.
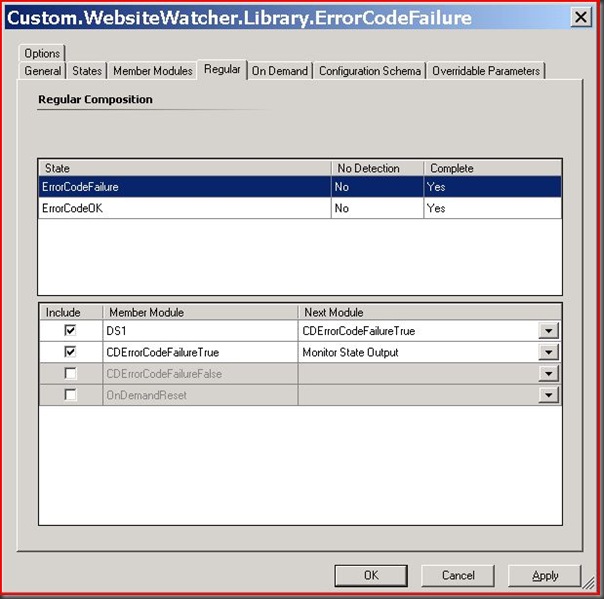
Next we have to specify what order the modules will be executed for the regular detection when there is a failure.
Next we have to specify what order the modules will be executed for the regular detection when there is not a failure.
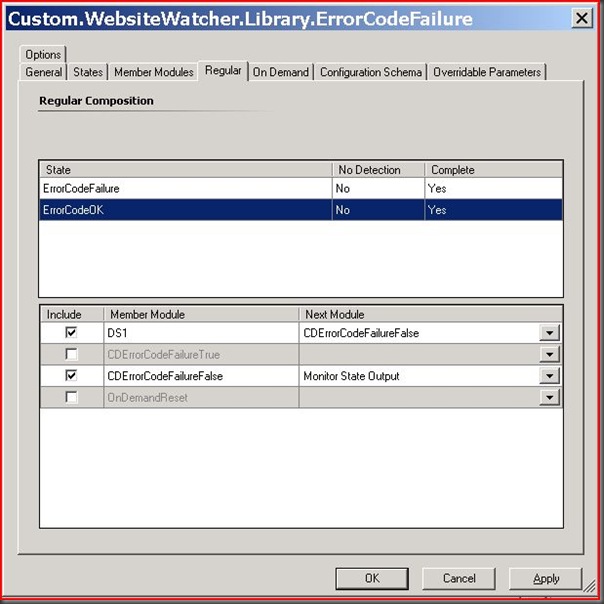
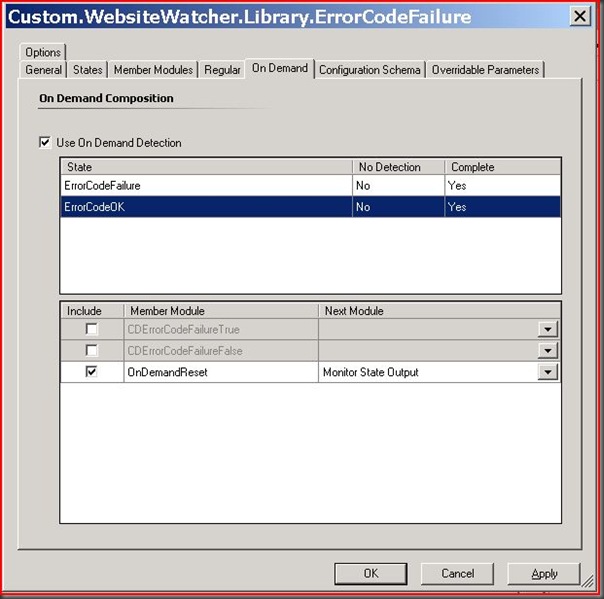
For On Demand we just use the ErrorCodeOK state.
The Configuration Schema defines what parameters this Monitor Type accepts.
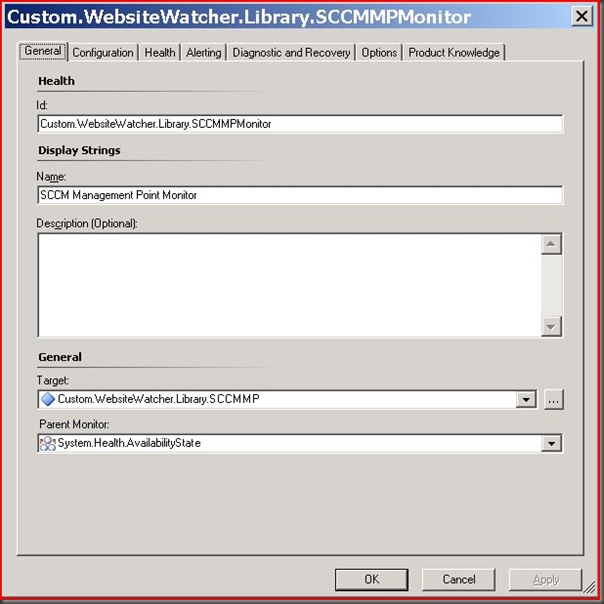
Step 3 – Create the Monitor. The monitor is a custom monitor which uses the monitor type we just created. It is also targeted to the SCCMMP class which we created in Part II of this series.
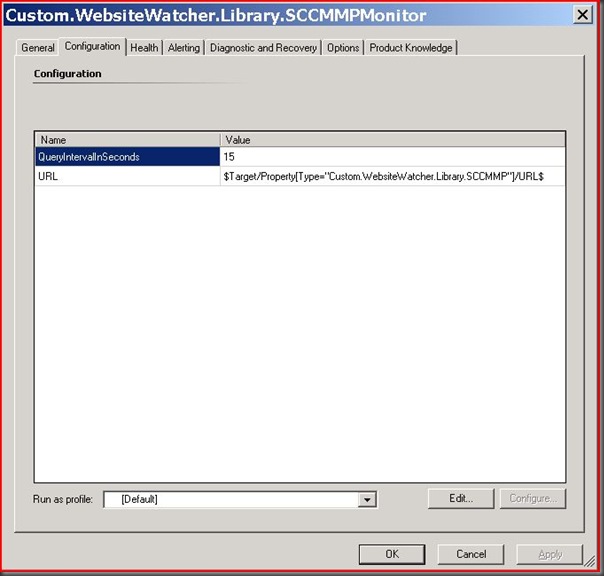
The Configuration is how often we want to query the URL and the URL itself. In this case we want the URL to be the registry value(s) that we discovered in the SCCMMP class. This is how one monitor can be used to watch thousands of websites.
We must tell the monitor which state means Critical and which means Healthy.
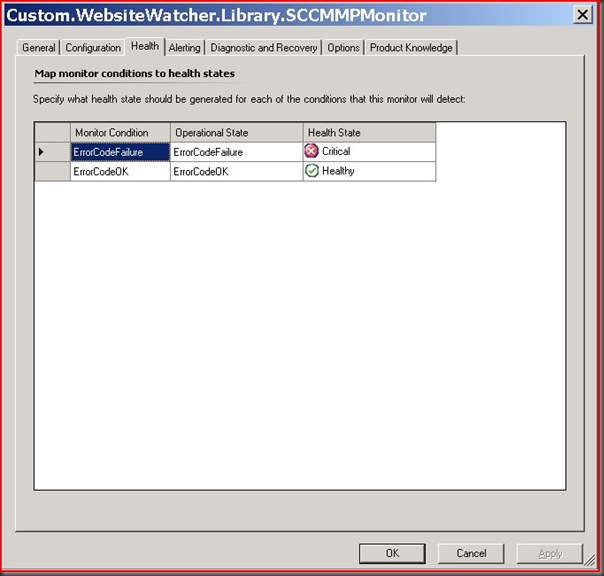
I set the example monitor to not alert but this can obviously be configured. Also, in the final solution for my customer we sealed the data sources and monitor types and used a different MP for the classes, discoveries, relationships, and monitors.
To test out this solution the MP you just created can be imported and if the agent from Part II still exists the discovered inventory should look like this:
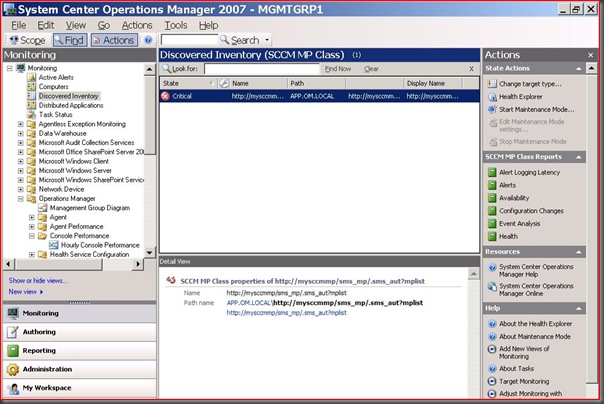
I don’t have a website with this name so it shows as critical. This is what Health Explorer looks like:
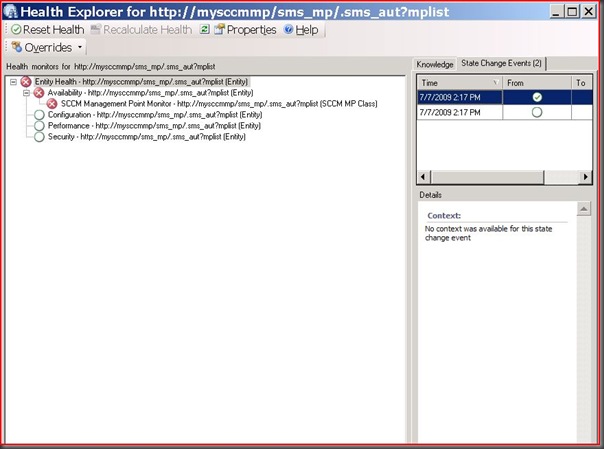
If you want to do some more testing add some real URLs to the SCCMMP registry key and add that key to some more watcher nodes. Also, open the MP attached to Part I and look at the other classes and data sources to understand how the text parsing and response time solutions work.
If you have any questions about this series please let me know.