Memory Based Recycling in IIS 6.0
Customers frequently ask questions regarding the recycling options for Application Pools in IIS.
Several of those options are self explanatory, whereas others need a bit of analysis.
I’m going to focus on the Memory Recycling options, which allow IIS to monitor worker processes and recycle them based on configured memory limits.
Recycling application pools is not necessarily a sign of problems in the application being served. Memory fragmentation and other natural degradation cannot be avoided and recycling ensures that the applications are periodically cleaned up for enhanced resilience and performance.
However, recycling can also be a way to work around issues that cannot be easily tackled. For instance, consider the scenario in which an application uses a third party component, which has a memory leak. In this case, the solution is to obtain a new version of the component with the problem resolved. If this is not an option, and the component can run for a long period of time without compromising the stability of the server, then memory based recycling can be a mitigating solution for the memory leak.
Even when a solution to a problem is identified, but might take time to implement, memory-based recycling can provide a temporary workaround, until a permanent solution is in place.
As mentioned before, memory fragmentation is another problem that can affect the stability of an application, causing out-of-memory errors when there seems to be enough memory to satisfy the allocation requests.
In any case, setting memory limits on application pools can be an effective way to contain any unforeseen situation in which an application that “behaves well” goes haywire. The advantage of setting memory limits on well behaved applications is that in the unlike case something goes wrong, there is a trace left in the event viewer, providing a first place where research of the issue can start.
When to configure Memory Recycling
In most scenarios, recycling based on a schedule should be sufficient in order to “refresh” the worker processes at specific points in time. Note that the periodic recycle is the default, with a period of 29 hours (1740 minutes). This can be an inconvenience, since each recycle would occur at different times of a day, eventually occurring during peak times.
If you have determined that you have to recycle your application pool based on memory threshold, it implies that you have established a baseline for your application and that you know your application’s memory usage patterns. This is a very important assumption, since in order to properly configure memory thresholds you need to understand how the application is using memory, and when it is appropriate to recycle the application based on that usage.
Configuration Options
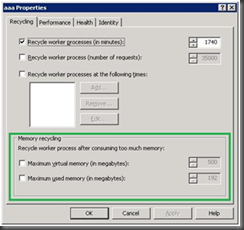
There are two inclusive options that can be configured for application pool recycling:
Figure 1 - Application Pool properties to configure Memory Recycling
Maximum Virtual Memory
This setting sets a threshold limit on the Virtual Memory. This is the memory (Virtual Address Space) that the application has used plus the memory it has reserved but not committed. To understand how the application uses this type of memory, you can monitor it by means of the Process – Virtual Bytes counter in Performance Monitor.
For instance, if you receive out of memory errors, but less than 800MB are reported as consumed, it is often a sign of memory fragmentation.
Maximum Used Memory
This setting sets a threshold limit on the Used Memory. This is the application’s private memory, the non-shared portion of the application’s memory. You can use the Process – Private Bytes counter in Performance Monitor to understand how the application uses this memory.
In the scenarios mentioned before, this setting would be used when you have detected a memory leak which cannot avoid (or is not cost effective to correct). This setting would set a “cap” on how much memory the application is “allowed” to leak before the application is restarted
Recycle Event Logging
Depending on the configuration of the web server and application pools, every time a process is recycled, an event may be logged in the System log.
By default, only certain recycle events are logged, depending on the cause for the recycle. Timed and Memory based recycling events are logged, whereas all other events are not.
This setting is managed by the LogEventOnRecycle metabase property for application pools. This property is a byte flag. The each bit indicates a reason for a recycle. Turning on a bit instructs IIS that the particular recycle event should be logged. The following table indicates the available values for the flag:
Flag |
Description |
Value |
AppPoolRecycleTime |
The worker process is recycled after a specified elapsed time. |
1 |
AppPoolRecycleRequests |
The worker process is recycled after a specified number of requests |
2 |
AppPoolRecycleSchedule |
The worker process is recycled at specified times. |
4 |
AppPoolRecycleMemory |
The worker process is recycled once a specified amount of used or virtual memory, expressed in megabytes, is in use. |
8 |
AppPoolRecycleIsapiUnhealthy |
The worker process is recycled if IIS finds that an ISAPI is unhealthy. |
16 |
AppPoolRecycleOnDemand |
The worker process is recycled on demand by an administrator. |
32 |
AppPoolRecycleConfigChange |
The worker process is recycled after configuration changes are made. |
64 |
AppPoolRecyclePrivateMemory |
The worker process is recycled when private memory reaches a specified amount. |
128 |
As mentioned before, only some of the events are configured to be logged by default. This default value is 137 (1 + 8 + 128).
It’s best to configure all the events to be logged. This will ensure that you understand the reasons why your application is being recycled. For information on how to configure the LogEventOnRecycle metabase property, see the support article at https://support.microsoft.com/kb/332088.
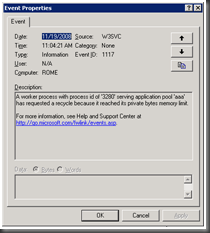
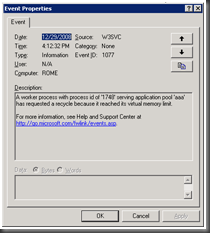
Below are the events logged because the memory limit thresholds have been reached:
Figure 2 - The application pool reached the Used Memory Threshold
Figure 3 - The application reached the Virtual Memory threshold
Note that the article lists the 1177 Event ID for Used (Private) Memory recycling, but in Event viewer it shows as Event ID 1117
Determining a threshold
Unlike other settings, memory recycling is probably the setting that requires the most analysis, since the memory of a system may behave differently depending on various factors, such as the processor architecture, running applications, usage patterns, /3GB switch, implementation of Web Gardens, etc.
In order to maximize service uptime, IIS 6.0 does Overlapped recycling by default. This means that when a worker process is due for a recycle, a new process is spawned and only when this new process is ready to start processing requests does the recycle of the old process actually occur. With overlapped mode, there will be two processes running at one point in time. This is one of the reasons why it is very important to understand the memory usage patterns of the application. If the application has a large memory footprint at startup, having two processes running concurrently could starve the system’s memory. For example, in a 32 bit Windows 2003 system with 4GB memory, Non-Paged Pool should remain over 285MB, Paged Pool over 330MB~360MB and System Free PTE should remain above 10,000. Additionally, Available Memory should not be lower than 50MB (these are approximate values and may be different for each system[1]). In a case in which recycling an application based on memory would cause these thresholds to be surpassed, Non-Overlapped Recycling Mode could help mitigate the situation, although it would impact the uptime of the application. In this type of recycling, the worker process is terminated first before spawning the new worker process.
In general, if the application uses X MB of memory, and it’s configured to recycle when it reaches 50% over the normal consumption (1.5 * X MB), you will want to ensure that the system is able to support 2.5 * X MB during the recycle without suffering from system memory starvation. Consider also the need to determine what type of memory recycling option is needed. Applications that use large amounts of memory to store application data or allocate and de-allocate memory frequently might benefit from having Maximum Virtual Memory caps, whereas applications that have heavy memory requirements (e.g. a large application level cache), or suffer from memory leaks could benefit from Maximum Memory Used caps.
The documentation suggests setting the Virtual Memory threshold as high as 70% of the system’s memory, and the Used Memory as high as 60% of the system’s memory. However, for recycling purposes, and considering that during the recycle two processes must run concurrently, these settings could prove to be a bit aggressive. As an estimate, for a 32 bit server with 4 GB of RAM, the Virtual Memory should be set to some value between 1.2 GB and 1.5 GB, whereas the Private bytes should be around 0.8 GB to 1 GB. These numbers assume that the application is the only one in the system. Of course, these numbers are quick rules of thumb and do not apply to every case. Different applications have very different memory usage patterns.
For a more accurate estimation, you should monitor your application for a long enough period so as to capture the information about memory usage (private and virtual bytes) of the application during the most common scenarios and stress levels. For example, if your application is used consistently on an everyday basis, a couple of week’s worth of data should be enough. If your application has a monthly process and each week of the month has different usage (users enter information at the beginning of the month and heavy reporting activity occurs at the end of the month) then a longer period may be appropriate. In addition, it is important to remember that data may be skewed if we monitor the application during the Holidays (when traffic is only 10% of the expected), or during the release of that long-awaited product (when traffic is expected to go as high as 500% of the typical usage).
Problems associated with recycling
Although recycling is a mechanism that may enhance application stability and reliability, it comes with a price tag. Too little recycling can cause problems, but too much of a good thing is not good either.
Non-overlapped recycles
As discussed above, there are times when overlapped recycling may cause problems. Besides the memory conditions described above, if the application creates or instantiates objects for which only one instance can exist at a particular time for the whole system (like a named kernel object), or sets exclusive locks on files, then overlapped recycle may not be an option. It is very important to understand that non-overlapped recycles may cause users to see error messages during the recycling process. In situations like this, it is very important to limit recycles to a minimum.
Moreover, if the time it takes for a process to terminate is too long, it may cause noticeably long outages of the application while it is recycling. In this case, it is very important to set an appropriate application pool shutdown timeout. This timeout defines the length of the period of time that IIS will wait for a worker process to terminate normally before it forces it to terminate. This is configured using the ShutdownTimeLimit metabase property (https://www.microsoft.com/technet/prodtechnol/WindowsServer2003/Library/IIS/1652e79e-21f9-4e89-bc4b-c13f894a0cfe.mspx?mfr=true).
To configure an application pool to use non-overlapped recycles, set the application pool’s metabase property DisallowOverlappingRotation to true. For more information on this property, see the metabase property reference at https://www.microsoft.com/technet/prodtechnol/WindowsServer2003/Library/IIS/1652e79e-21f9-4e89-bc4b-c13f894a0cfe.mspx?mfr=true.
Session state
Stateful applications can be implemented using a variety of choices of were to store the session information. For ASP.Net, some of these are cookie-based, in-process, Session State Server, SQL Server. For classic ASP, this list is more limited. These implementation decisions have an impact on whether to use Web Gardens and how to implement Web Farms. Additionally, these may determine the effect that application pool recycling has on the application.
In the case of in-memory sessions, the session information is kept in the worker process’ memory space. When a recycle is requested, a new worker process is started and session information on the recycled process is lost. This effectively affects any active session that exists in that application. This is yet another reason why the amount of recycles should be minimized.
Application Startup
Recycling an application is an expensive task for the server. Process creation and termination are required to start the new worker process and bring down the old one. In addition, any application level cache and other data in memory are lost and need to be reloaded. Depending on the application, these activities can significantly reduce the performance of the application, providing a degraded user experience.
Incidentally, another post in this blog discusses another of the reasons application startup may be slow. In many cases this information will help speed up the startup of your application. If you haven’t done it yet, check it out at https://blogs.msdn.com/pfedev/archive/2008/11/26/best-practice-generatepublisherevidence-in-aspnet-config.aspx.
Memory Usage checks
When an application is configured to recycle based on memory, it is up to the worker process to perform the checks. These checks are done every minute. If the application has surpassed the memory caps at the time of the check, then a recycle is requested.
Bearing this behavior in mind, consider a case in which an application behaves well most of the times, but under certain conditions, it behaves really badly. By misbehavior I mean very aggressive memory consumption during a very short period of time. In this case, the application can cause other problems by exhausting the system’s memory before the worker process checks for memory consumption and any recycle can kick in. This could lead to problems that are difficult to troubleshoot and limit the effectiveness of memory based recycling.
Conclusion
The following points summarize good practices when using memory based recycling:
- Configure IIS so it logs all recycle events in the System Log.
- Use memory recycling only if you understand the application’s memory usage patterns.
- Use memory based recycling as a temporary workaround until permanent fixes can be found.
- Remember that memory based recycling may not work as expected when the application consumes very large amounts of memory in a very short period of time (less than a minute).
- Closely monitor recycles and ensure that they are not too many (reducing the performance and/or availability of the application), or too few (allowing memory consumption of the application to create too much memory pressure on the server).
- Use overlapped recycling when possible.
Thanks,
Santiago
Santiago Canepa is an Argentinean relocate working as Development PFE. In his beginnings, he made custom made software in Clipper. Worked for the Argentinean IRS (DGI) while working towards his BS in Information Systems Engineering. He worked as a consultant both in Argentina and the US on Microsoft technologies, and lead a development team before joining Microsoft. He has passion for languages (don’t engage in a discussion about English or Spanish syntax – you’ve been warned), loves a wide variety of music and enjoys spending time with his husband and daughter. Can usually be found online at ungodly hours in front of his computer(s).”
[1] Vital Signs for PFE – Microsoft Services University
Comments
Anonymous
January 21, 2009
PingBack from http://www.anith.com/?p=528Anonymous
May 16, 2011
markAnonymous
October 28, 2012
Thx Santiago for this useful note.


