Web Test Authoring and Debugging Techniques for Visual Studio 2010
Contents
Overview
How Web Performance Tests Work
Overview of New Features in VS 2010
Debugging a Web Test to Find and Fix Dynamic Parameters
Adding Your Own Web Test Recorder Plugin to Make Record/Playback “Just Work”
More Recorder Enhancements in VS 2010
New Tools Options for the Recorder
Looping and Branching in Web Tests
Request Details Editor
Request Body Plugins
Result Viewer Plugins
Overview
This post follows similar papers done after VS 2005:
Web Test Authoring and Debugging Techniques, and again after VS 2008: Web Test Authoring and Debugging Techniques for VS 2008.
With each release of VS we have made major strides in Web Test Authoring and Debugging. With VS 2008, we added a number of features to address the most common challenges with Web test authoring, the most important being a low-level http recorder and a automatic correlation tool. This covered the most prevalent challenges outlined in Web Test Authoring and Debugging Techniques. Again with VS 2010 we have made major strides in Web test authoring and debugging:
- More http recordings “just work”
- New tools to help you debug and fix the ones that don’t, and
- New extensibility points for the recorder, editor, and results viewer enable you, us and our community to release rich functionality “out of band” to handle custom applications and rich data types.
A New Name, But Under the Covers Still the Same
In this release we renamed "Web Test” to “Web Performance Test” to highlight the primary scenario for Web tests, which is using them as scripts in a load test to model user actions. Load tests are used to drive load against a server, and then measure server response times and server response errors. Because we want to generate high loads with a relatively low amount of hardware, we chose to drive Web performance tests at the protocol layer rather than instantiating a browser. While Web performance tests can be used as functional tests, this is not their primary focus (see my post Are Web Tests Functional Tests?). You will see that I still refer to “Web Performance Tests” as “Web Tests” for short.
If you really want to test the user experience from the browser, use a Coded UI test to drive the browser.
In order to be successful working with Web Performance Tests, it is important you understand the fundamentals about how they work.
Web Performance Tests Work at the HTTP Layer
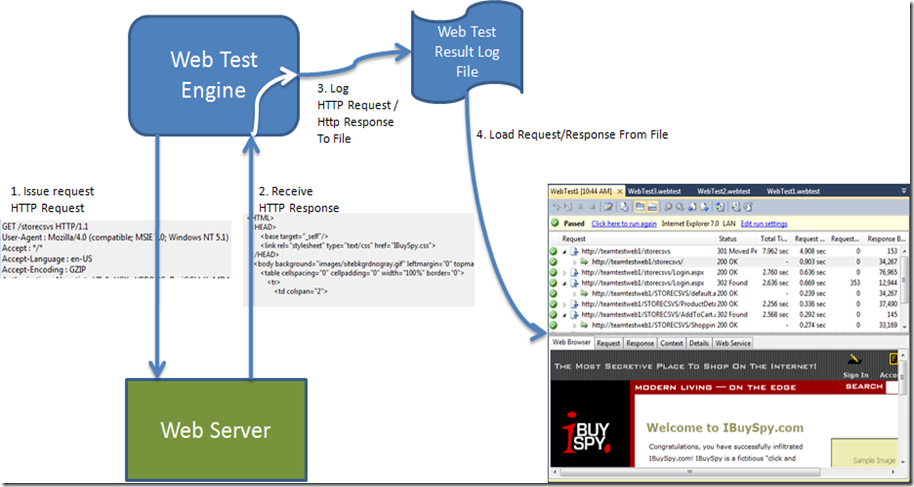
The most common source of confusion is that users do not realize Web Performance Tests work at the HTTP layer. The tool adds to that misconception. After all, you record in IE, and when running a Web test you can select which browser to use, and then the result viewer shows the results in a browser window. So that means the tests run through the browser, right? NO! The Web test engine works at the HTTP layer, and does not instantiate a browser. What does that mean? In the diagram below, you can see there are no browsers running when the engine is sending and receiving requests:
What Does This Mean for You?
This design has fundamental and far-reaching impact if you are working with Web tests. It is critical that you understand this if you are going to be successful authoring and debugging Web tests. This escapes even customers who have worked extensively with Web tests, and is a major source of confusion. The Web test engine:
- Sends and receives data at the HTTP layer.
- Does NOT run a browser.
- Does NOT run java script.
- Does NOT host ActiveX controls or plugins.
Ok, so Web tests work at the HTTP layer. What about requests sent and received by javascript and/or browser plugins? The best example for java script generating HTTP traffic is AJAX calls. The most common example of browser plugins are SilverLight or Flash. The Web test recorder will record HTTP traffic from AJAX calls and from most (but not all) browser plugins.
Web Tests Can Succeed Even Though It Appears They Failed
A common source of confusion comes from the browser preview in the Web test result viewer. This browser control does not run java script nor host plugins, which is by design since the engine does not do this either, and for security reasons. A common technique in pages requiring java script is to sense this, and put up an alternate page when the browser is not running java script, such as “java script required on this page”:
This page looks like it failed, when if fact it succeeded! Looking closely at the response, and subsequent requests, it is clear the operation succeeded. As stated above, the reason why the browser control is pasting this message is because java script has been disabled in this control.
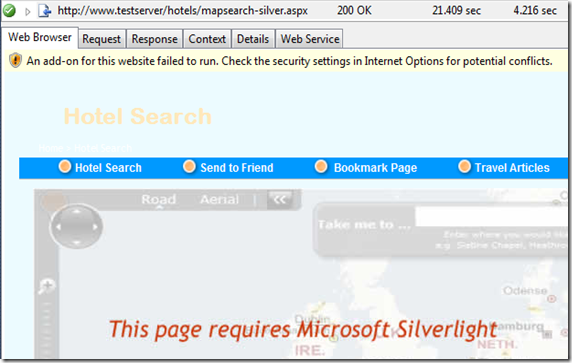
Another variant of this is plugins such as this page that is using SilverLight:
Again, it looks like the page failed, when in fact at the HTTP layer it succeeded.
A Common Challenge: Dynamic Parameters
One of the major challenges with working at the HTTP layer are “dynamic parameters”. A dynamic parameter is a parameter whose value changes every each time it is run. The most common case is a session parameter, such as a login session ID. Each time a user logs in to a site, he is given a new login session ID. In order to simulate this user’s actions, the test cannot simply replay the recorded session ID, it must replay the new session ID. Web tests handled most patterns of dynamic parameters automatically, but there are still some patterns it does does not automatically handle.
Huge Strides Forward with VS 2010
With ever more complicated applications being built on HTTP, it is getting harder and harder to develop scripts at the HTTP layer.
With VS 2010, we again have made tremendous strides across the tool, in recording, editing, and debugging, so help you be successful doing this. Some of the high-level features are:
- Finding and fixing dynamic parameters
- Enabling an extensibility point in the recorder such that record/playback “just works” for any app (effectively enabling you to automate #1).
- Enabling extensibility points for editing and viewing results of rich data types
We have made a number of other improvements as well, most notably:
Editor Improvements
- Support for looping and branching in Web tests
- Request details editor
- Create meaningful reports using the reporting name on Page
- Goal validation rule
Recorder Improvements
- Record/playback of file upload “just works”
- Record all dependents by default
- New recorder options in Tools Options
- Improvements in hidden field and dynamic parameter correlation
Debugging a Web Test to Find and Fix Dynamic Parameters
The VS recorder automatically handles most classes of dynamic parameters: cookies, query string and form post parameter values, and hidden fields. In VS 2010 we have made incremental improvements on each of these. Yet there are still a few dynamic parameter patterns that cannot be deterministically detected and fixed up.
Our goal with this release was to build tooling around the flow for debugging a web test, mostly to help find and fix dynamic parameters. This flow is described in Sean’s seminal post, How to Debug a Web Test. The flow is this:
- Record a Web test and play it back. Playback fails.
- Look at the form post and query string parameters in a failed request and determine if any look to be dynamic
- Go to the web test to determine if they are bound to an extracted value
- If not, search through the log to find where the parameter is set. Or better yet, search through the recording log to find the unique value in order to find where it is getting set.
- Add an extraction rule and bind the parameter value to the extracted value.
In VS 2010, you’ll find commands in Web test playback and the editor that seamlessly support this flow:
- A new recorder log that enables you to see the http traffic that was generated from IE. This is a huge new feature critical for debugging tests. You can jump from a request, request parameter, or response in playback to the same context in the recording log to compare them.
- Search in playback and search and replace in the Web test editor. These features are super-important for quickly finding and fixing dynamic parameters.
- Jump from a request in playback to that same request in the editor. This greatly increases the efficiency of the workflow.
- Create an extraction rule directly from playback, automatically setting the correct parameters on the extraction rule. Again, this increases efficiency.
Together, these features really grease the debugging and fix up workflow, and will make you much more efficient when working with web tests.
A quick overview of the flow:
From the Web test results viewer, select a from a failed request that looks like a dynamic parameter. Right-click from the parameter on the Request tab to jump to the editor to confirm it was not bound.
In the editor, you can see this value is not bound to a context parameter:
Now go back to the results viewer. At this point, you want to find the dynamic values in the response of one of the previous requests, as the dynamic parameter value had to have come from a response body (since that’s how http and browsers work). To do this, you want to go to the recorder log. The reason you want to do this from the recorder log is that the recording will have the original recorded value in it. To do this, click on the recorder log icon (we really should have put this on the context menu too!).
This will take you to the same request with the same parameter selected. Now right-click on the parameter and do a quick find to find the parameter value in a previous response. Again, you want to do this from the recording log, since the parameter is dynamic the value will be in the recording log but not the playback log.
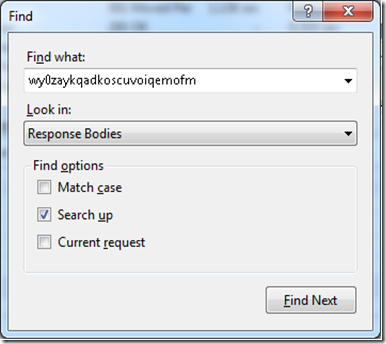
Search up in response bodies to find the value. Note that if the dynamic string was constructed in java script, you may need to only search of the dynamic part of the value:
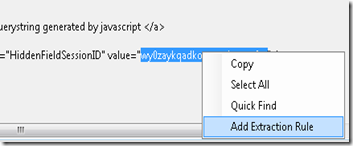
Once you find it, right click to add an extraction rule:
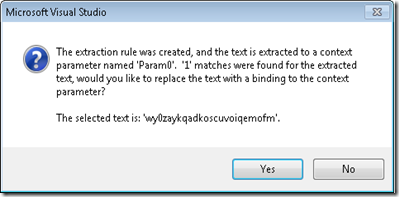
Once the extraction rule is added, you also need to bind the parameter values. Choose yes to the message box to launch search and replace from the Web test editor.
You can see that we have added tooling to make finding and fixing dynamic parameters much easier in VS 2010!!!
Engineering the Solution
To engineer this solution, we made several important design changes to Web tests and Web test results.
- First, we changed the persistence mechanisms for Web test results to store results to a separate log file rather than the in the trx.
- We created a full public API for the Web test result.
- We stamp request ids in each http request (enables jumping between playback and the editor).
- The recorder generates a Web test result file and saves it as part of the recording.
About the Web Performance Test Recorder Log
The Recorder Log is a file stored in the same directory as the web test is recorded into. You can get to the recorder log from the Web test results viewer as shown above. Or you can open it from VS, browse to the Web test folder and look for *.webtestresult to find recorder log files in your project folder. The name of the recorded result file is stored in the RecordedResultFile attribute in the web test xml file. This file is not added to the project by default, if you wish to share it with team members consider adding it to the solution so it will get checked in to source control.
The recorder log is persisted in the same file format as a Web test result. There is a full API over this data (see the WebTestResult and WebTestResultDetails classes).
Adding Your Own Recorder Plugins to Make Record/Playback “Just Work”
Once you have found and fixed up the dynamic parameters in a test, consider writing a recorder plugin to do this for you automatically each time you record a new test for this web site.
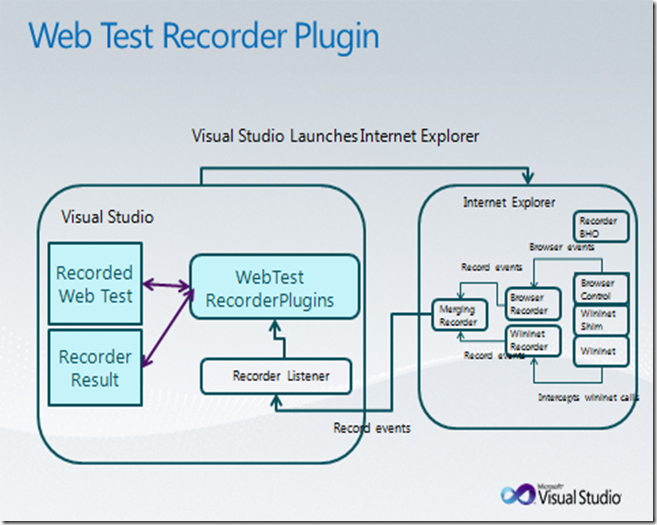
Recorder plugins are a new, super-powerful capability to the VS 2010 recorder. Recorder plugins are an extensibility hook that gives you full access to the recorded result and the recorded Web test, and move seamlessly from a recorded request to that corresponding request in the web test. This enables you to make any modifications you see fit to the generated Web test. This is in effect a “catch-all”, the ultimate power and productivity tool in your hands to save time fixing up Web tests.
I really can’t emphasize enough what a powerful solution this is. If you will be scripting a web site for any given period of time, and it requires you fix up the recordings, it will be worthwhile for you to invest in building a recorder plugin for it.
Recorder plugins can be used for any number of reasons: fixing up dynamic parameters (adding extraction rules and bindings), automatically adding validation rules, automatically adding data sources and doing data bindings, filtering out recorded dependents, etc.
Recorder plugins are pretty straightforward to code up and install. Recorder Plugins derive from the WebTestRecorderPlugin class. Once you have implemented a plugin, just drop the assembly into either of these directories, and then restart VS:
%ProgramFiles%\Microsoft Visual Studio 10.0\Common7\IDE\PrivateAssemblies\WebTestPlugins
%USERPROFILE%\My Documents\Visual Studio 10\WebTestPlugins
Here’s sample recorder plugin code that adds an extraction rule and binds query string parameters to the extracted value.
 using System;
using System.Collections.Generic;
using System.Text;
using System.ComponentModel;

using Microsoft.VisualStudio.TestTools.WebTesting;
using Microsoft.VisualStudio.TestTools.WebTesting.Rules;
using System.Diagnostics;

namespace RecorderPlugins
{
    [DisplayName("Correlate ReportSession")]
    [Description("Adds extraction rule for Report Session and binds this to querystring parameters that use ReportSession")]
    public class CorrelateSessionId : WebTestRecorderPlugin
    {
        public override void PostWebTestRecording(object sender, PostWebTestRecordingEventArgs e)
        {
            // Loop through the responses in the recording, looking for the session Id.
            bool foundId = false;
            foreach (WebTestResultUnit unit in e.RecordedWebTestResult.Children)
            {
                WebTestResultPage recordedWebTestResultPage = unit as WebTestResultPage;
                if (recordedWebTestResultPage == null)
                {
                    continue;
                }
                // If we haven't found the session Id yet, look for it in this response.
                if (!foundId)
                {
                    // Look for the "ReportSession" string in the response body of a recorded request
                    int indexOfReportSession = recordedWebTestResultPage.RequestResult.Response.BodyString.IndexOf("ReportSession");
                    if (indexOfReportSession > -1)
                    {
                        // Find the corresponding page in the test, this is the page we want to add an extraction rule to
                        WebTestRequest requestInWebTest = e.RecordedWebTest.GetItem(recordedWebTestResultPage.DeclarativeWebTestItemId) as WebTestRequest;
                        Debug.Assert(requestInWebTest != null);

                        if (requestInWebTest != null)
                        {
                            foundId = true;
                            string startsWith = "?ReportSession=";
                            string endsWith = "&";
                            string contextParamName = "ReportSession";
                            AddExtractTextRule(requestInWebTest, startsWith, endsWith, contextParamName);
                            e.RecordedWebTestModified = true;
                        }
                    }
                }
                else
                {
                    // Once we have extracted the session id, bind any session id parameters to the context parameter
                    // This call gets the corresponding request in the web test.
                    WebTestRequest requestInWebTest = e.RecordedWebTest.GetItem(recordedWebTestResultPage.DeclarativeWebTestItemId) as WebTestRequest;
                    Debug.Assert(requestInWebTest != null);

                    if (requestInWebTest != null)
                    {
                        BindQueryStringParameter(requestInWebTest, "SessionId", "SessionId");
                    }
                }
            }
        }

        ///
        /// Code to add an ExtractText rule to the request.
        ///
        ///
        ///
        ///
        ///
        private static void AddExtractTextRule(WebTestRequest request, string startsWith, string endsWith, string contextParameterName)
        {
            // add an extraction rule to this request
            // Get the corresponding request in the Declarative Web test
            ExtractionRuleReference ruleReference = new ExtractionRuleReference();

            ruleReference.Type = typeof(ExtractText);
            ruleReference.ContextParameterName = contextParameterName;
            ruleReference.Properties.Add(new PluginOrRuleProperty("EndsWith", endsWith));
            ruleReference.Properties.Add(new PluginOrRuleProperty("StartsWith", startsWith));
            ruleReference.Properties.Add(new PluginOrRuleProperty("HtmlDecode", "True"));
            ruleReference.Properties.Add(new PluginOrRuleProperty("IgnoreCase", "True"));
            ruleReference.Properties.Add(new PluginOrRuleProperty("Index", "0"));
            ruleReference.Properties.Add(new PluginOrRuleProperty("Required", "True"));
            ruleReference.Properties.Add(new PluginOrRuleProperty("UseRegularExpression", "False"));

            request.ExtractionRuleReferences.Add(ruleReference);
        }

        public static void BindQueryStringParameter(WebTestRequest requestInWebTest, string queryStringParameterName, string contextParameterName)
        {
            // This code adds data binds the SessionId parameter to the context parameter
            foreach (QueryStringParameter param in requestInWebTest.QueryStringParameters)
            {
                if (param.Name.Equals(queryStringParameterName))
                {
                    param.Value = "{{" + contextParameterName + "}}";
                }
            }
        }
    }
}
More Recorder Enhancements in VS 2010
In addition to lighting up these powerful new scenarios, the VS 2010 does what it did in VS 2008 only better.
No More Empty Recorder Pane
With VS 2008, there were several cases for which the recorder would not record requests. Most of these involved the IE 7 and IE 8 process model, where these browsers start new processes when crossing security contexts (thus the need to run VS as Admin). These problems have been fixed in VS 2010, as the recorder now records across IE process boundaries.
More Apps “Just Work”
There were a few cases for which hidden field correlation and dynamic parameter detection did not work with VS 2008. You let us know about those cases, and we have improved the hidden field correlation and dynamic parameter detection tools to handle them in VS 2010. These were mostly around dynamic parameters in AJAX requests.
And binary post bodies are now handled correctly, which were not always handled correctly with VS 2008.
The recorder now also automatically handles File Uploads so they will “just work”. Files that are uploaded are automatically added to the project, and the file upload file name will be dynamically generated to enable you to upload the same file to different names automatically.
New Tools Options for the Recorder
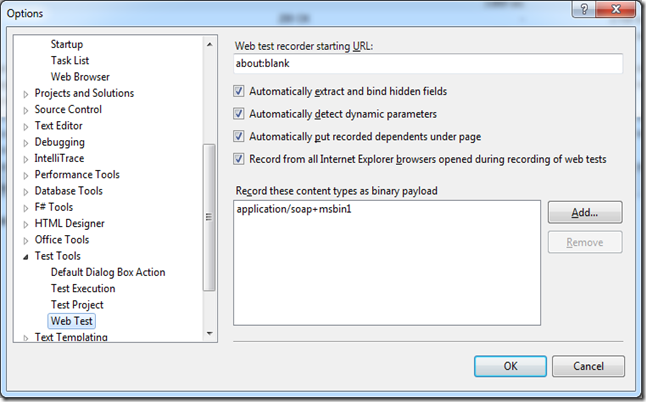
You asked for more control over the recorder, you got it with new recorder options in Tools Options:
Web Test Editor Enhancements in VS 2010
One of our goals with VS 2010 was to enable you to stay in “declarative” Web tests for more use cases without having to move to a coded Web test. One reason you had to go to code with VS 2005 or VS 2008 was to do looping or conditional execution in your Web test.
Looping and Branching
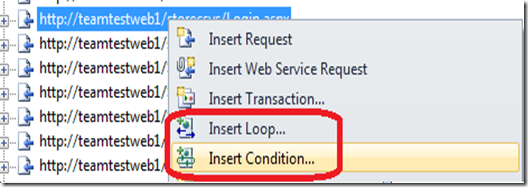
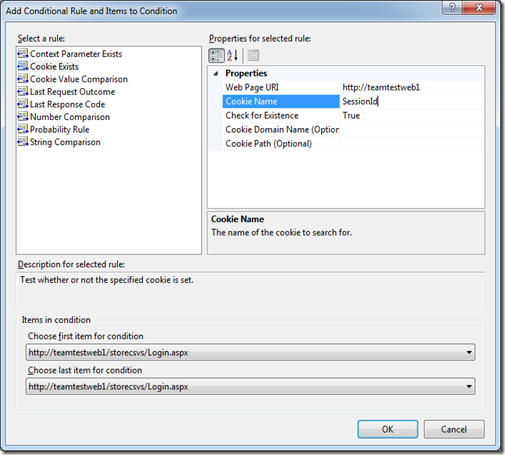
The VS 2010 declarative editor now supports powerful new looping and branching constructs. Looping and branching are based on conditional rules, which follow the exact same extensibility model as validation rules and extraction rules. There are many rules “in the box”:
You can see above, there are a lot of flexible rules already built in.
A few scenarios this enables:
- Conditional logins. In a load test, if you want to simulate a user logging in once and then doing many operations in the test, this can be accomplished easily in a conditional rule. Session IDs are typically handled by cookies, and you can easily set up a rule to only go to the login pages if the login has not happened yet.
- Variability in your scripts. If you want users to occasionally skip steps in a script, or randomly repeat some steps, this is easily achieved with the probability rule which will only execute some requests based on the probability you specify.
- Loop until some operation succeeds. If an operation is expected to fail for some users, but will succeed on retry, and you need to model the retry, you can do this by looping while the operation is not successful. To do this, use an extraction rule to indicate whether or not the action was successful, then use the Context Parameter Exists to loop until it is successful.
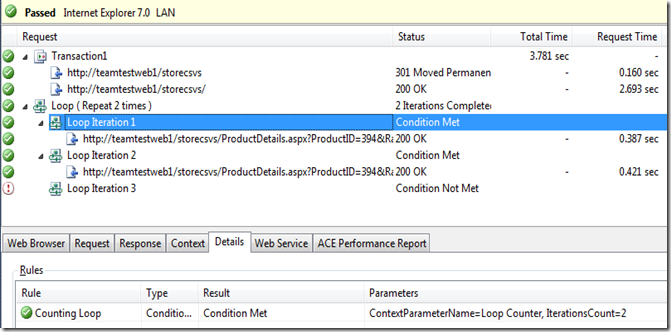
You can debug your loops and conditions using the results viewer, which shows the results of conditional evaluations.
A word of caution: do not use loops to do many, many loops within a given test. This will “gum up” the load test engine, since it function is to control virtual user execution. Also, an entire web test result is stored in memory, including all the loops. So running a web test with many loops will run your machine out of memory. You can still run these in a load test to avoid this, but for the reason stated above we recommend against this.
More Editor Features
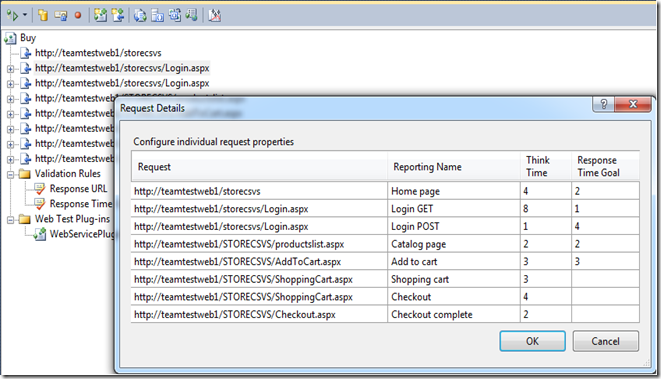
I already talked about search and replace in the editor above. There is also a super-handy new Request Details editor that enables you to quickly see and edit the think times, reporting name, and goal for each page. You should use this view each time you record a new test.
Use the Reporting Name and Response Time Goals to really light up your excel load test reports, as both are propagated to the reports.
Setting the response time goal will also help you to find slow requests in a load test, as by default there is a new Response Time Goal validation rule added to the test. This rule will fail pages that exceed the goal by the threshold you specify (by default the tolerance is 0). This rule will cause slow requests to fail, and enable you to collect logs on the failures, which may help you determine why the page is slow.
New Extensibility Points to Handle Rich Data
One area we did not address in VS 2010 is better editor and result viewer handling of rich data types. If you have AJAX code sending and receiving Web services, REST, or JSON requests, you know how difficult these are to work with. Like other releases, our mantra was if we couldn’t get it in the box, we wanted to expose extensibility points to enable us and the community to add tooling to help in this area.
To this end, we have enabled two extensibility points that will enable us to address this out of band:
- Web test editor request body editor plugins.
- New tabs and menu items in Web test result viewer.
We plan to release new editor and playback plugins around the time we RTM, so keep an eye on codeplex.com\teamtestsplugins for new releases.
Web Test Editor Request Body Plugins
Web Test request body plugins provide a way to plug a custom editor into VS for editing form post bodies. These plugins implement either IStringHttpBodyEditorPlugin or IBinaryHttpBodyEditorPlugin, and enable you to customize the edit pane for different post body content.
The IStringHttpBodyEditorPlugin interface is super-simple:
public interface IStringHttpBodyEditorPlugin
{
object CreateEditor(string contentType, string initialValue);
string GetNewValue();
bool SupportsContentType(string contentType);
}
Basically, SupportsContentType allows you to specify which content types your editor supports. When the editor encounters a particular content type, it will scan the list of editor plugins for the first one it finds to support that type, then host the editor control. The CreateEditor call is used by the plugin to instantiate an instance of the control and provides the initial value to be edited, and the GetNewValue is the way the plugin returns the result of the editing session. The IBinaryHttpBodyEditorPlugin is the same, except that it gets and puts byte arrays.
public interface IBinaryHttpBodyEditorPlugin
{
object CreateEditor(string contentType, byte[] initialValue);
byte[] GetNewValue();
bool SupportsContentType(string contentType);
}
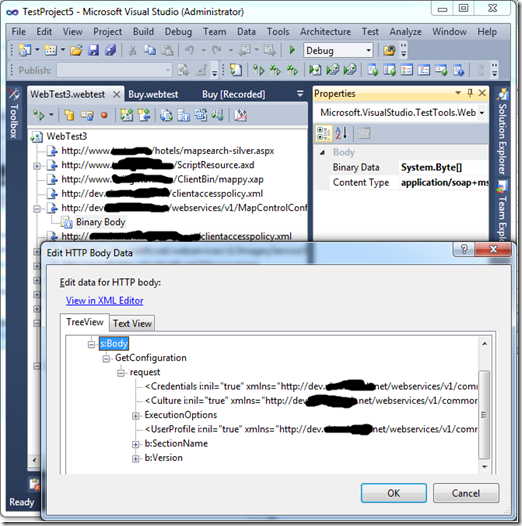
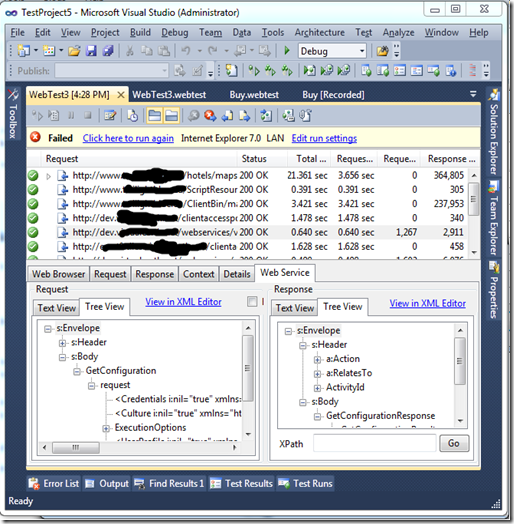
We are working on creating new editors for the most common formats now, and will ship “out of band” to codeplex.com\teamtestplugins around RTM. Here’s a screen shot of the editor handling msbin1 data in a rich way (I rubbed out some URLs of this public facing site):
Web test editor plugins must be deployed to %ProgramFiles%\Microsoft Visual Studio 10.0\Common7\IDE\PrivateAssemblies\WebTestPlugins.
Web Test Result Viewer Plugins
The Web Test Result Viewer also supports design time plugins. There are many scenarios for these plugins, here are some example scenarios:
- The coolest comes from dynaTrace.
- Tools that automatically analyze the result to point out potential performance problems (see blogs.msdn.com\mtaute for an example).
- Custom viewers for rich request and response data.
This third scenario is the one I want to delve into more in this section. Just as you want a rich editing experience for working with Web services, REST, or JSON requests, you want a rich way to view this data in the result viewer as well. The Web test result viewer plugins provide the perfect extensibility point for this.
Result viewer plugins are a bit more involved to code up and install the editor plugins.
Like the response body editor, we are working on out of band plugins for the Web test result viewer. Here is a screen shot of the result view plugin for binary data:
Notice the tree views in the bottom panes, showing binary data as a tree.
Conclusion
Your takeaway after reading this blog post should be - “Wow, VS 2010 is fantastic and will save me tons of time creating and maintaining Web tests, I have to have it!”
By working with you directly on the forums and through our blogs, we saw the types of problems you are hitting developing scripts. We also listened to your feedback and folded it back into the tool. In places we didn’t have time to address, we’ve added extensibility points to enable us to deliver features to you out of band, and for you to create your own solutions.
Now you can say: “I’m a performance tester, and Visual Studio 2010 was my idea!”
Ed.
Comments
Anonymous
October 11, 2010
Surely you are just joking, or maybe not. My takeaway from this article is more in the direction of "The VS team has made progress but there are still shortcomings in the tool. Other tools might be better suited for my purposes and/or be more powerful. The author of this article vastly overrates the value of the chosen web test strategy"Anonymous
March 23, 2011
The comment has been removedAnonymous
August 07, 2011
we are getting a session time out error while playback the web test. while recording its not throwing any error, but while play back, as soon i login it is redirecting to session time out page. session time out is 15 min for our application. also displaying an error message that "Your login attempt was not successful. Please try again."Anonymous
October 04, 2011
Hi, I have got an alternative solution for Load testing Silverlight 4 application calling WCF binary services, even through STS https login process : Its Fiddler2 + StresStimulus add-on. It gives basic results {dont expect a report as rich as VS 2010}, but at least it works 1st time with nearly no configuration. It also gives few indicators, including TTFB: memoprojects.blogspot.com/.../alleluia-load-test-tool-for-silverlight.html Vincent THAVONEKHAMAnonymous
February 02, 2012
Hi, Iam using VSTS 2010 ultimate version for web testing using silver light application,. i created a workflow - patient registration. after created the script, the patient names are not captured in the script any where. now i want to paramater the patient name. can any one give me a solution plsAnonymous
February 28, 2012
I am a big fan of VS Load Test. However, I have started running into issues with some of our applications that use JavaScript forms, including a Microsoft SharePoint application. Unfortunately I am forced to go back to using a different tool for these applications, unless Microsoft adds support for JavaScript into the webtest. Is there any plans to do so, or any add on I can use until it is in place? I would like to move all of my load tests to VS 2010, but with this limitation I cannot.Anonymous
September 02, 2012
Hi Ed, I have webtests which reads the parameter values from a database. The piece of code which reads these values are outside transactions. Does this effect the response time and is there any impact on the overall load test. Thanks, ChetanAnonymous
November 11, 2013
I am facing one issue that i am giving constant load 2users and 2 iterations . 2 iterations are working fine but problem is of 2 vusers, it is taking only one vuser. What is the issue that i am facing. Is it the problem of settings in vsts2010.Anonymous
December 18, 2013
Hi, I am facing the below issue. "System Time Out" "Your session has timed out and you need to close all the browsers and open up a new browser to login to the application." As needed, I have extracted JSessionID using custom webtest plugin to use it in subsequent steps. JSessionID got extracted successfully. Please let me know if I need to change the sessiontimeout value and the location of the web.config file or is this due to some other configuration issue. Thanks, Donbosco rdonbosco@gmail.comAnonymous
May 19, 2014
Hi, I am testing silverlight application and i am getting the error that the content is loading. And the full response is not available for this. How this can be tackled. I have installed the addon of webservice plugin but still the response is seen blank in it.Anonymous
September 29, 2014
This was really very helpful. Thanks for thisAnonymous
March 10, 2015
Hi Ed Glas, I am using VSTS 2013 as part of my web performance testing. I need to apply the extraction rule for jeid but it is coming in binary data. could you please help me out how can i extract these jeid value from the binary data. below is the binary data for the same, and i need to write extraction rule for new jeid. 0x00000000 7B 22 48 61 73 45 72 72 6F 72 22 3A 66 61 6C 73 {"HasError":fals 0x00000010 65 2C 22 4E 65 77 4A 65 49 64 22 3A 22 65 65 31 e,"NewJeId":"ee1 0x00000020 34 34 34 61 31 2D 31 38 31 64 2D 34 39 62 39 2D 444a1-181d-49b9- 0x00000030 38 34 35 36 2D 61 34 35 37 30 30 61 39 30 39 36 8456-a45700a9096 0x00000040 35 22 7D 5"} Thanks Jagan MohanAnonymous
July 06, 2015
How to get the values generated by client side code like javascript. I'm using vs2013 ultimate.
