Create a custom probe for Application Gateway by using the portal
In this article, you add a custom health probe to an existing application gateway through the Azure portal. Azure Application Gateway uses these health probes to monitor the health of the resources in the backend pool.
Before you begin
If you don't already have an application gateway, visit Create an Application Gateway to create an application gateway to work with.
Create probe for Application Gateway v2 SKU
Probes are configured in a two-step process through the portal. The first step is to enter the values required for the probe configuration. In the second step, you test the backend health using this probe configuration and save the probe.
Enter probe properties
Sign in to the Azure portal. If you don't already have an account, you can sign up for a free one-month trial
In the Azure portal Favorites pane, click All resources. Click the application gateway in the All resources blade. If the subscription you selected already has several resources in it, you can enter partners.contoso.net in the Filter by name… box to easily access the application gateway.
Select Health probes and then select Add to add a new health probe.
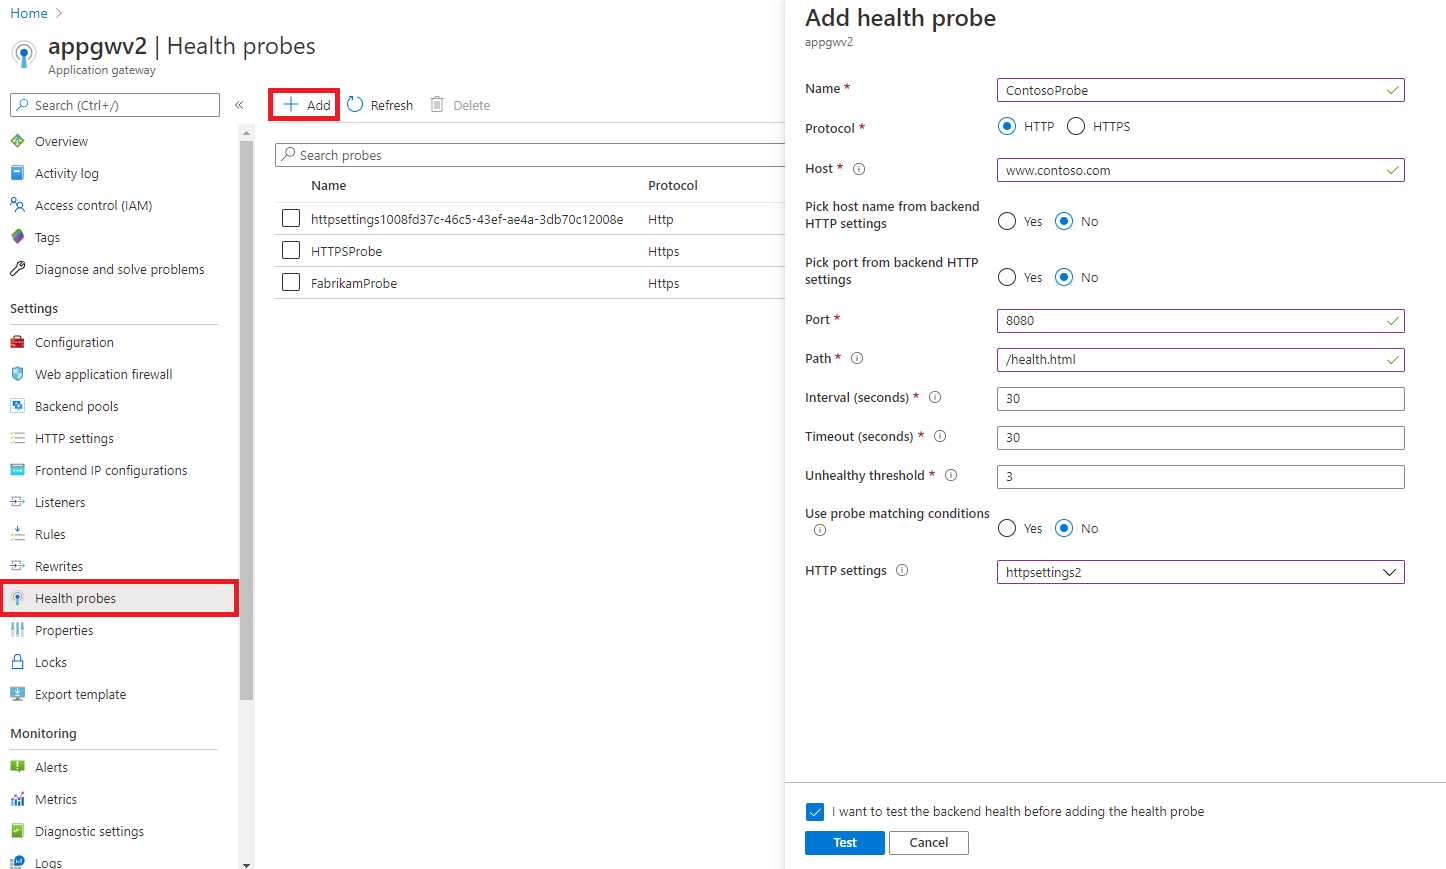
On the Add health probe page, fill out the required information for the probe, and when complete select OK.
Setting Value Details Name customProbe This value is a friendly name given to the probe that is accessible in the portal. Protocol HTTP or HTTPS The protocol that the health probe uses. Host i.e contoso.com This value is the name of the virtual host (different from the VM host name) running on the application server. The probe is sent to <protocol>://<host name>:<port>/<urlPath> This can also be the private IP address of the server, or the public IP address, or the DNS entry of the public IP address. The probe will attempt to access the server when used with a file based path entry, and validate a specific file exists on the server as a health check. Pick host name from backend HTTP settings Yes or No Sets the host header in the probe to the host name from the HTTP settings to which this probe is associated. Specially required for multi-tenant backends such as Azure app service. Learn more Pick port from backend HTTP settings Yes or No Sets the port of the health probe to the port from HTTP settings to which this probe is associated. If you choose no, you can enter a custom destination port to use Port 1-65535 Custom port to be used for the health probes Path / or any valid path The remainder of the full url for the custom probe. A valid path starts with '/'. For the default path of http://contoso.com, just use '/'. You can also input a server path to a file for a static health check instead of web based. File paths should be used while using public / private ip, or public ip dns entry as the hostname entry. Interval (secs) 30 How often the probe is run to check for health. It isn't recommended to set the lower than 30 seconds. Timeout (secs) 30 The amount of time the probe waits before timing out. If a valid response isn't received within this time-out period, the probe is marked as failed. The timeout interval needs to be high enough that an http call can be made to ensure the backend health page is available. The time-out value shouldn't be more than the ‘Interval’ value used in this probe setting or the ‘Request timeout’ value in the HTTP setting, which will be associated with this probe. Unhealthy threshold 3 Number of consecutive failed attempts to be considered unhealthy. The threshold can be set to 0 or more. Use probe matching conditions Yes or No By default, an HTTP(S) response with status code between 200 and 399 is considered healthy. You can change the acceptable range of backend response code or backend response body. Learn more HTTP Settings selection from dropdown Probe will get associated with the HTTP settings selected here and therefore, will monitor the health of that backend pool, which is associated with the selected HTTP setting. It will use the same port for the probe request as the one being used in the selected HTTP setting. You can only choose those HTTP settings, which aren't associated with any other custom probe.
The only HTTP settings that are available for association are those that have the same protocol as the protocol chosen in this probe configuration, and have the same state for the Pick Host Name From Backend HTTP setting switch.Important
The probe will monitor health of the backend only when it's associated with one or more HTTP settings. It will monitor backend resources of those backend pools which are associated to the HTTP settings to which this probe is associated with. The probe request will be sent as <protocol>://<hostName>:<port>/<urlPath>.
Test backend health with the probe
After entering the probe properties, you can test the health of the backend resources to verify that the probe configuration is correct and that the backend resources are working as expected.
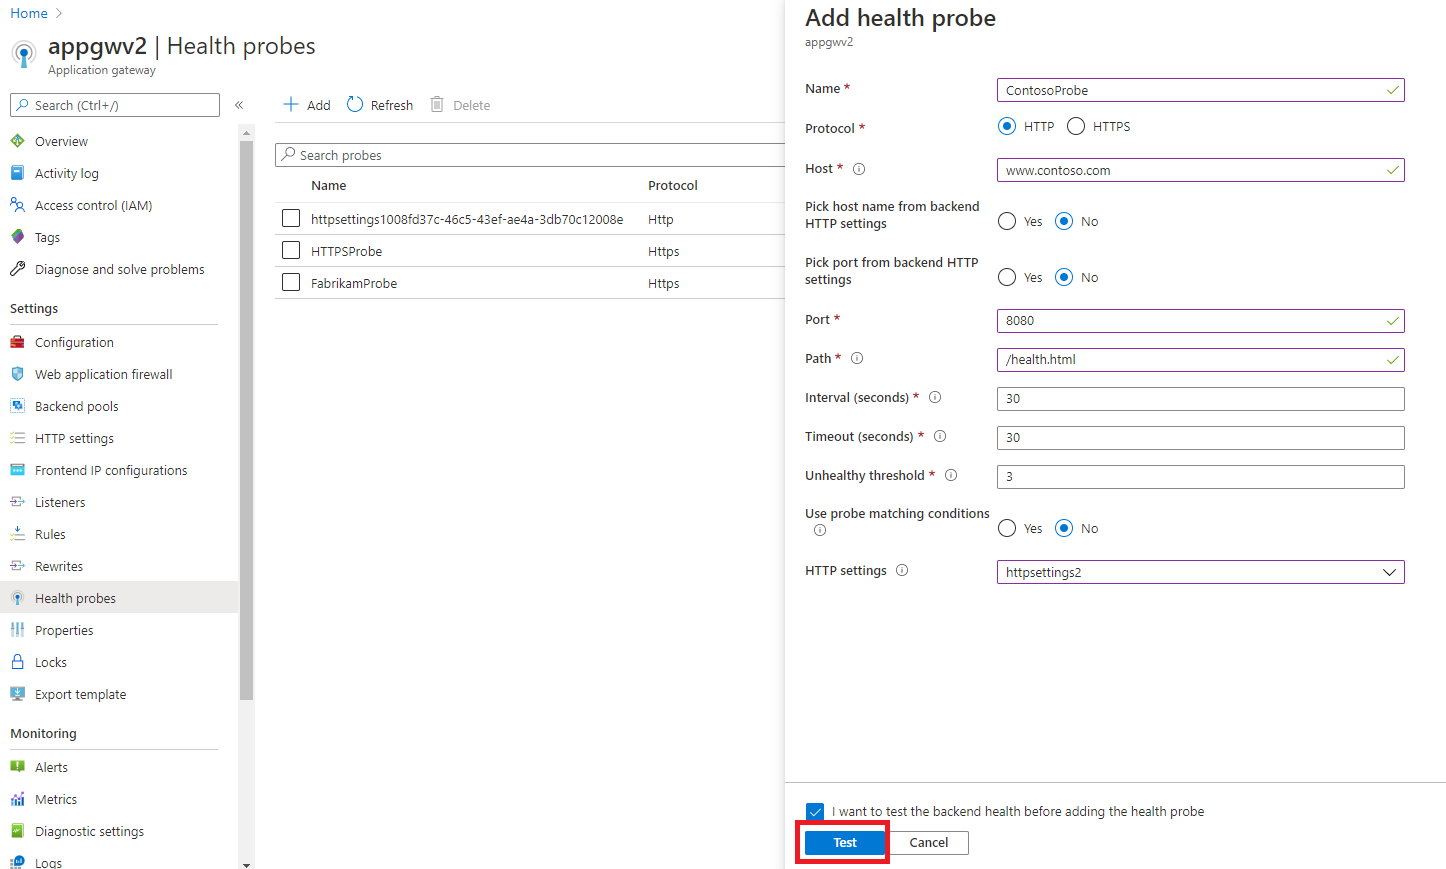
Select Test and note the result of the probe. The Application gateway tests the health of all the backend resources in the backend pools associated with the HTTP settings used for this probe.
If there are any unhealthy backend resources, then check the Details column to understand the reason for unhealthy state of the resource. If the resource has been marked unhealthy due to an incorrect probe configuration, then select the Go back to probe link and edit the probe configuration. Otherwise, if the resource has been marked unhealthy due to an issue with the backend, then resolve the issues with the backend resource and then test the backend again by selecting the Go back to probe link and select Test.
Note
You can choose to save the probe even with unhealthy backend resources, but it isn't recommended. This is because the Application Gateway won't forward requests to the backend servers from the backend pool, which are determined to be unhealthy by the probe. In case there are no healthy resources in a backend pool, you won't be able to access your application and will get a HTTP 502 error.
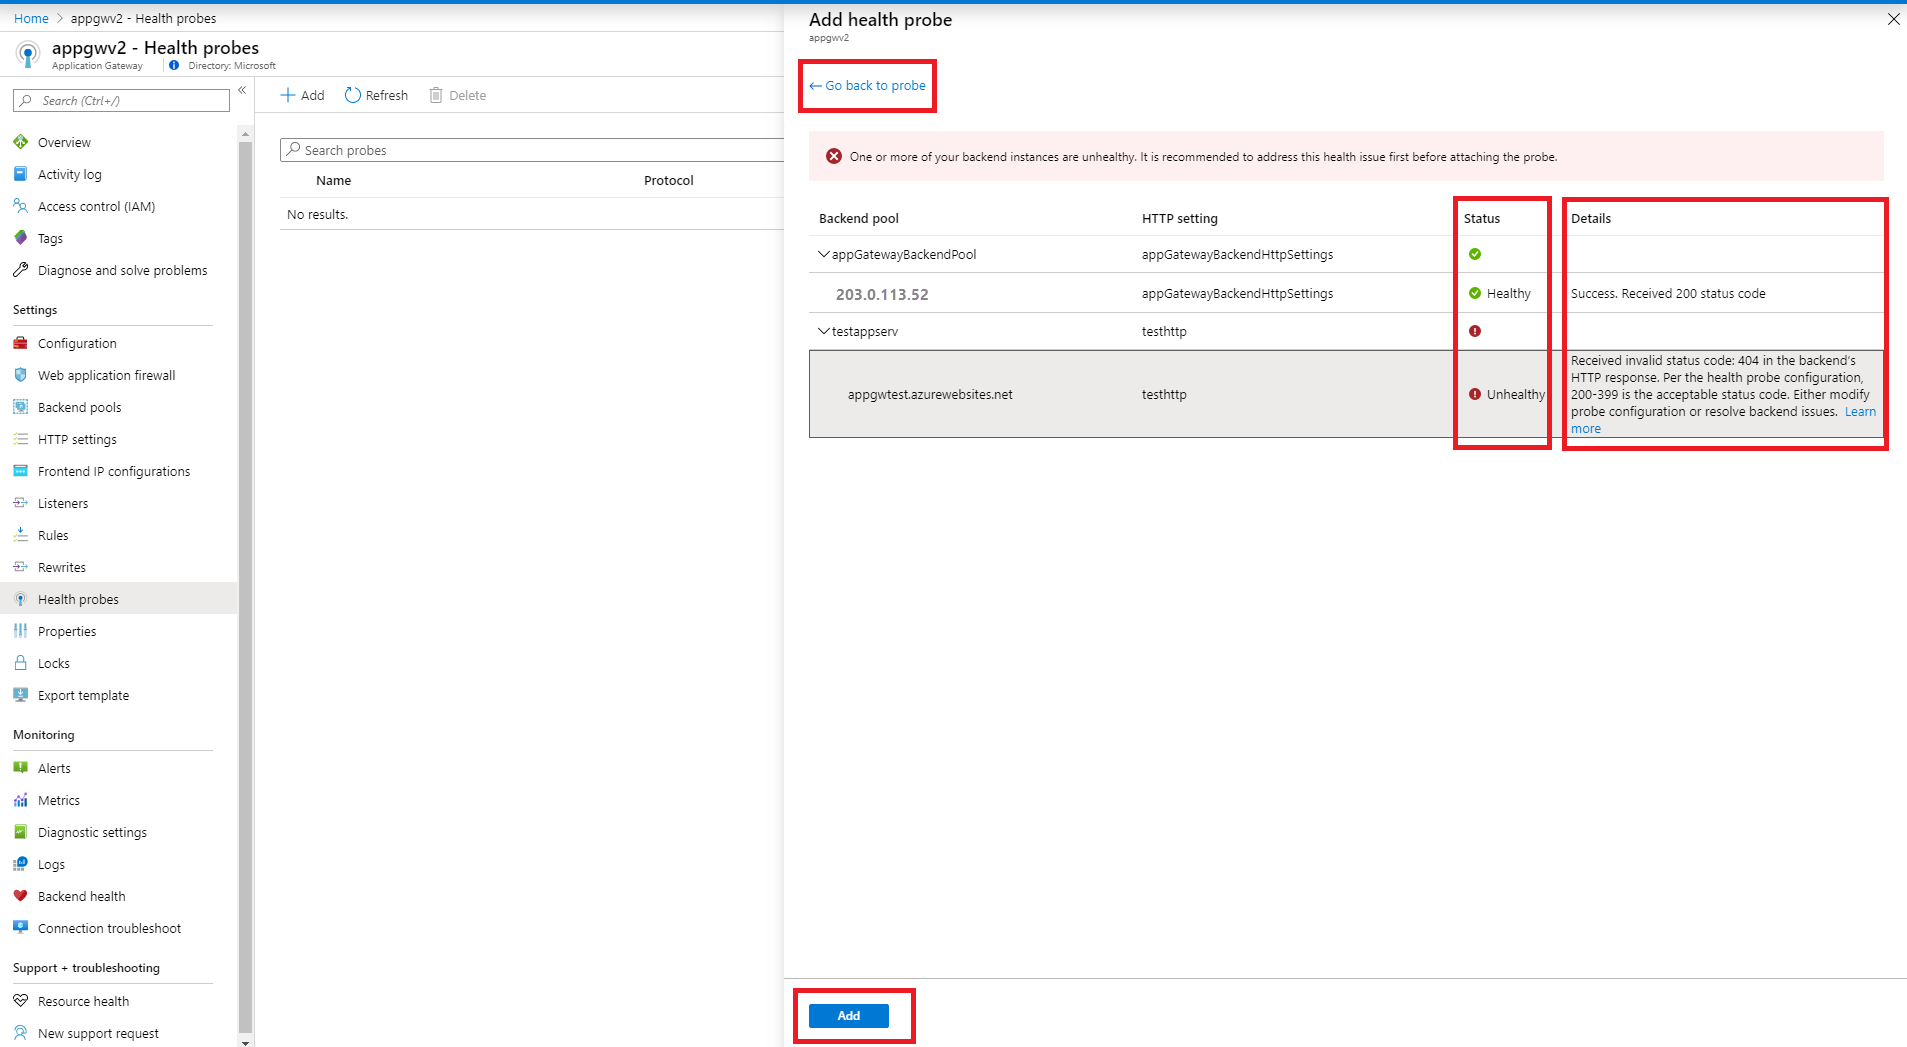
Select Add to save the probe.
Create probe for Application Gateway v1 SKU
Probes are configured in a two-step process through the portal. The first step is to create the probe. In the second step, you add the probe to the backend http settings of the application gateway.
Create the probe
Sign in to the Azure portal. If you don't already have an account, you can sign up for a free one-month trial
In the Azure portal Favorites pane, select All resources. Select the application gateway in the All resources page. If the subscription you selected already has several resources in it, you can enter partners.contoso.net in the Filter by name… box to easily access the application gateway.
Select Probes and then select Add to add a probe.
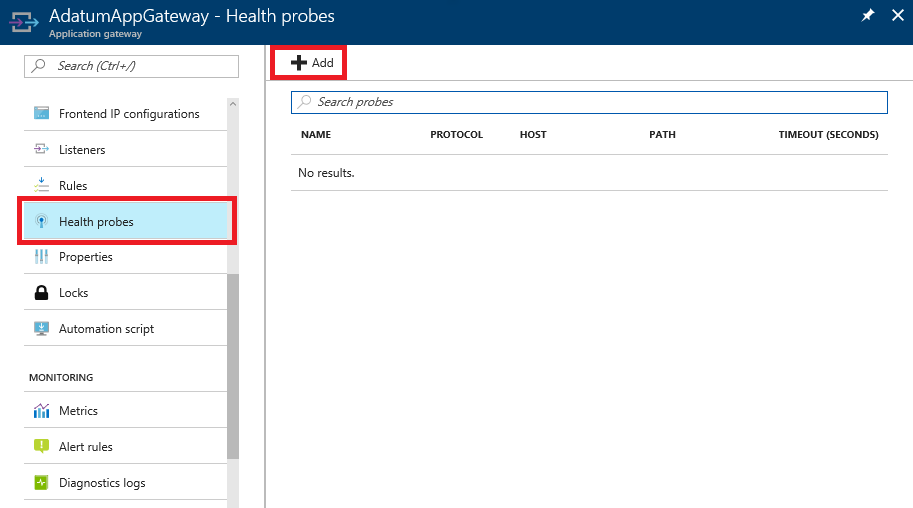
On the Add health probe blade, fill out the required information for the probe, and when complete select OK.
Setting Value Details Name customProbe This value is a friendly name given to the probe that is accessible in the portal. Protocol HTTP or HTTPS The protocol that the health probe uses. Host i.e contoso.com This value is the name of the virtual host (different from the VM host name) running on the application server. The probe is sent to (protocol)://(host name):(port from httpsetting)/urlPath. This is applicable when multi-site is configured on Application Gateway. If the Application Gateway is configured for a single site, then enter '127.0.0.1'. You can also input a server path to a file for a static health check instead of web based. File paths should be used while using public / private ip, or public ip dns entry as the hostname entry. Pick host name from backend HTTP settings Yes or No Sets the host header in the probe to the host name of the backend resource in the backend pool associated with the HTTP Setting to which this probe is associated. Specially required for multi-tenant backends such as Azure app service. Learn more Path / or any valid path The remainder of the full url for the custom probe. A valid path starts with '/'. For the default path of http://contoso.com, just use '/' You can also input a server path to a file for a static health check instead of web based. File paths should be used while using public / private ip, or public ip dns entry as the hostname entry. Interval (secs) 30 How often the probe is run to check for health. It isn't recommended to set the lower than 30 seconds. Timeout (secs) 30 The amount of time the probe waits before timing out. If a valid response isn't received within this time-out period, the probe is marked as failed. The timeout interval needs to be high enough that an http call can be made to ensure the backend health page is available. The time-out value shouldn't be more than the ‘Interval’ value used in this probe setting or the ‘Request timeout’ value in the HTTP setting, which will be associated with this probe. Unhealthy threshold 3 Number of consecutive failed attempts to be considered unhealthy. The threshold can be set to 1 or more. Use probe matching conditions Yes or No By default, an HTTP(S) response with status code between 200 and 399 is considered healthy. You can change the acceptable range of backend response code or backend response body. Learn more Important
The host name isn't the same as server name. This value is the name of the virtual host running on the application server. The probe is sent to <protocol>://<hostName>:<port from http settings>/<urlPath>
Add probe to the gateway
Now that the probe has been created, it's time to add it to the gateway. Probe settings are set on the backend http settings of the application gateway.
Click HTTP settings on the application gateway, to bring up the configuration blade click the current backend http settings listed in the window.
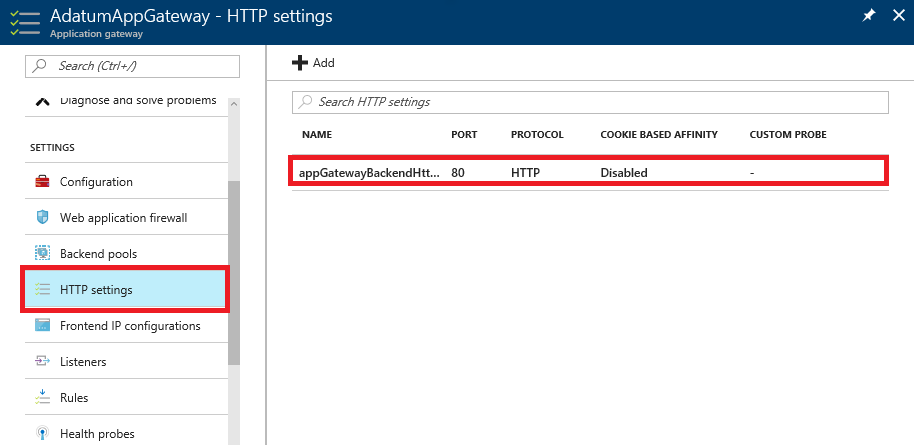
On the appGatewayBackEndHttpSettings settings page, check the Use custom probe checkbox and choose the probe created in the Create the probe section on the Custom probe drop-down. When complete, click Save and the settings are applied.
Next steps
View the health of the backend servers as determined by the probe using the Backend health view.