Introducción a las jerarquías en cuadros de mandos de Power BI
SE APLICA A: Power BI Desktop
Servicio Power BI
Las métricas admiten cuadros de mandos en cascada que se acumulan en las jerarquías configuradas en el cuadro de mandos. Puede configurar una jerarquía para un cuadro de mandos y asignar los modelos semánticos de Power BI a los que hacen referencia los objetivos a los niveles de jerarquía y los campos propietarios, creando automáticamente una nueva vista de cuadro de mandos para cada segmento de los datos.
Requisitos previos para crear jerarquías
Estos son los requisitos para configurar un cuadro de mandos jerárquico:
- Las jerarquías requieren un área de trabajo Premium o Premium Per User.
- Necesita permisos de edición en el cuadro de mandos.
- El cuadro de mandos necesita al menos un objetivo conectado.
- Necesita acceso de compilación a los modelos semánticos conectados en el cuadro de mandos.
Cómo se ven las jerarquías en los cuadros de mandos
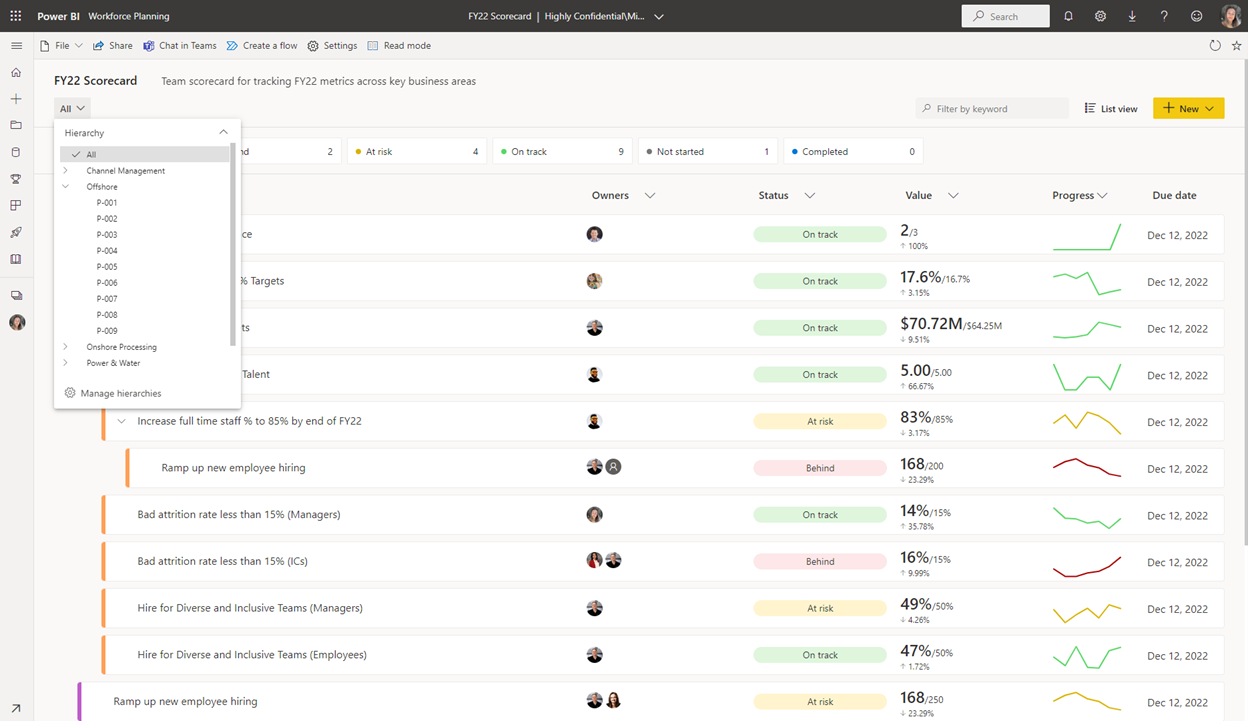
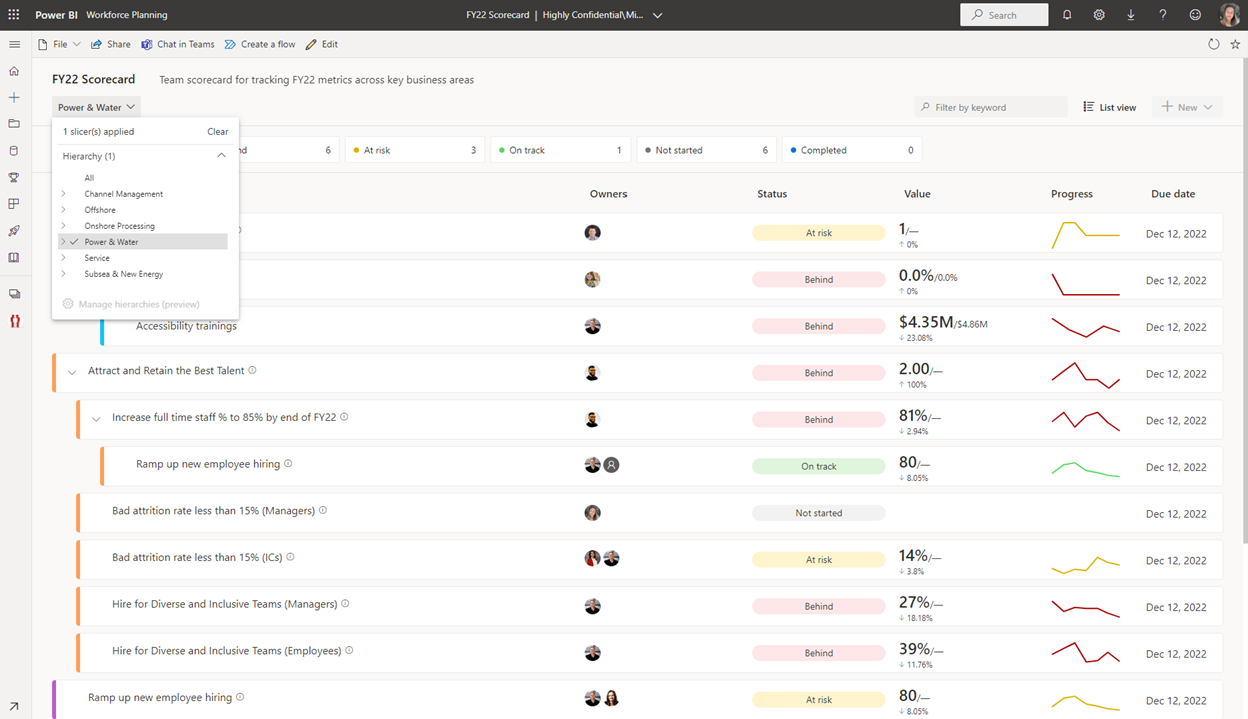
Power BI aplicará en cascada los objetivos conectados a cada nivel de la jerarquía. Los usuarios pueden profundizar fácilmente en la jerarquía para ver el progreso, los estados y realizar comprobaciones en distintos niveles. En las imágenes siguientes, verá los diferentes niveles de una jerarquía de proyectos en el slicer. A medida que acceda a cada objetivo o subnivel de la jerarquía, los valores de las métricas, los estados, los responsables y el progreso cambiarán junto con ellos.
Este cuadro de mandos se configura con una jerarquía y el filtro está abierto exponiendo la segmentación de jerarquía:
En esta imagen, el filtro está abierto exponiendo la segmentación de jerarquía y los filtros aplicados en el cuadro de mandos:
Configuración de la jerarquía (versión preliminar)
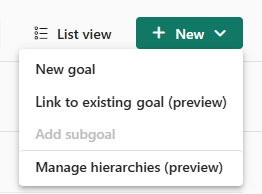
En el modo de edición del cuadro de mandos, seleccione Configurar una jerarquía en el menú Nuevo.
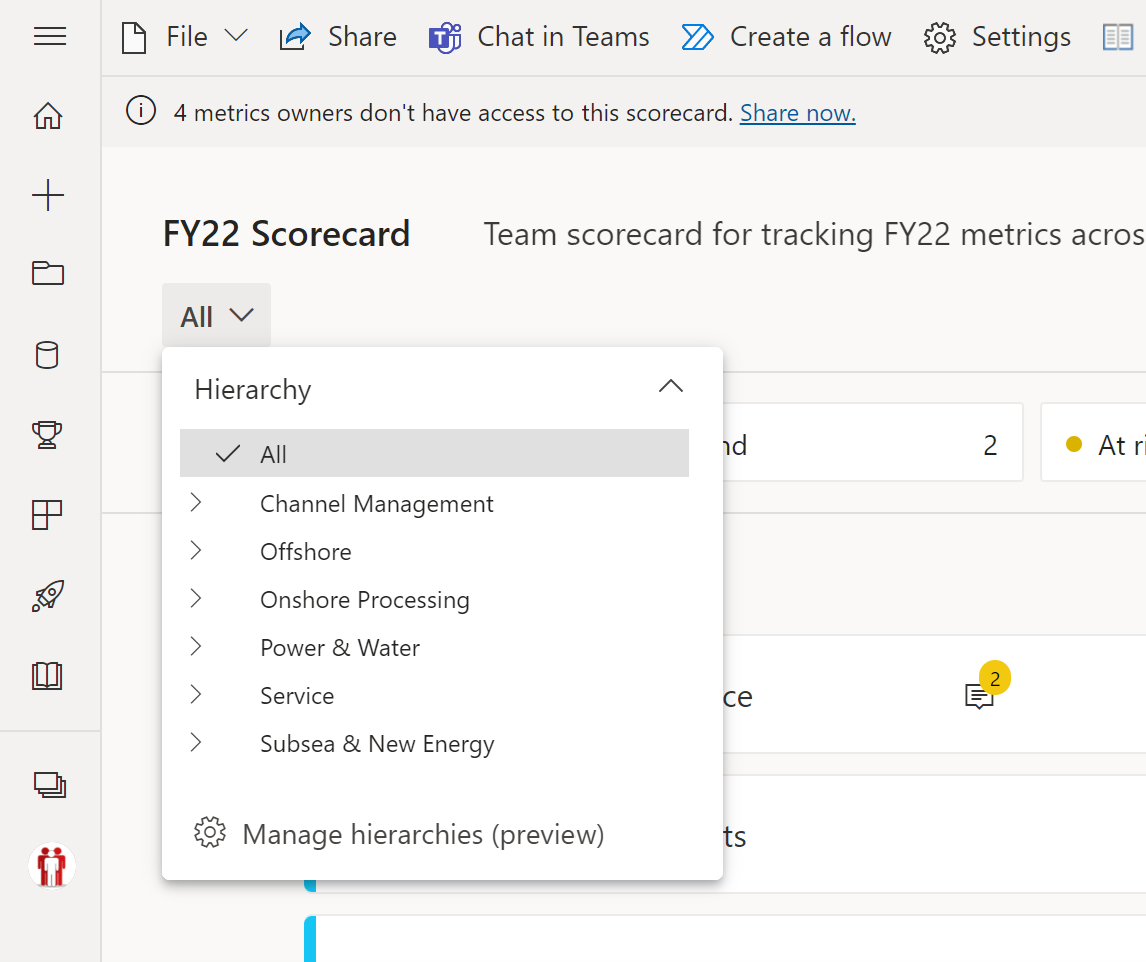
También puede seleccionar Administrar jerarquías en la segmentación Todos.
Asignar niveles de jerarquía a datos
Para empezar a configurar la jerarquía, asígnele un nombre, cree los niveles y asígnelos a los modelos semánticos conectados en el cuadro de mandos. Puede crear varias jerarquías para ver secciones cruzadas entre segmentos de datos, por ejemplo, si hay una jerarquía geográfica y de productos, puede usar la segmentación para ver un cuadro de mandos que muestre las métricas por "portátiles en Alemania" o "dispositivos inteligentes en Seattle, WA".
En la experiencia de configuración, verá todos los modelos semánticos que están conectados a las métricas en el cuadro de mandos.
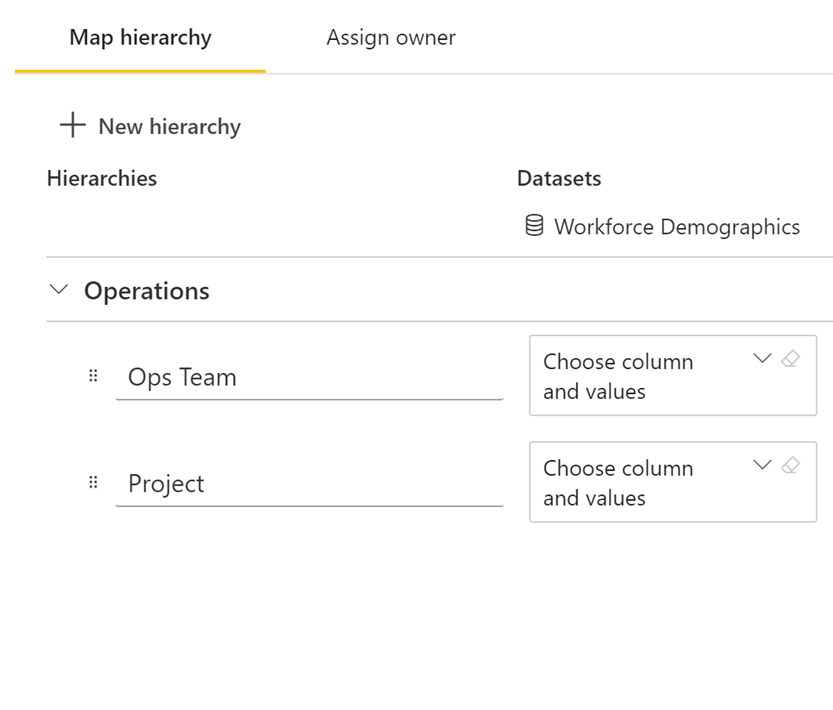
Asigne los datos de los modelos semánticos subyacentes a los niveles de jerarquía. Si hay campos que no desea llevar al mapeo, puede desmarcarlos usando las casillas de verificación en la lista de campos.
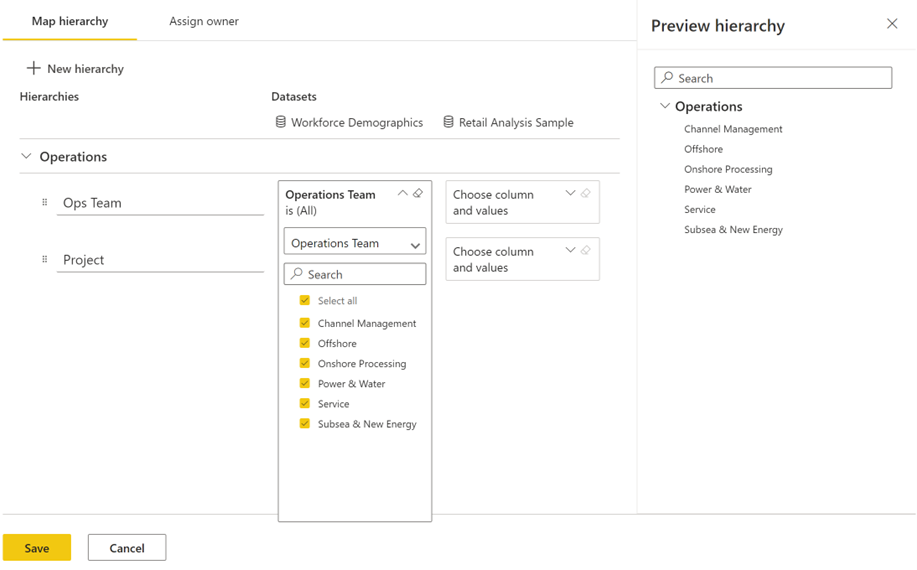
A medida que asigna los modelos semánticos a los datos correspondientes en cada nivel de jerarquía, verá una vista previa en el panel derecho para comprobar que está en la pista correcta.
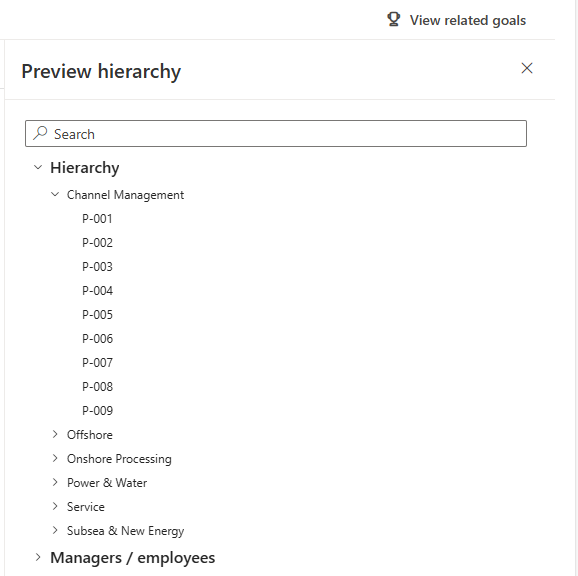
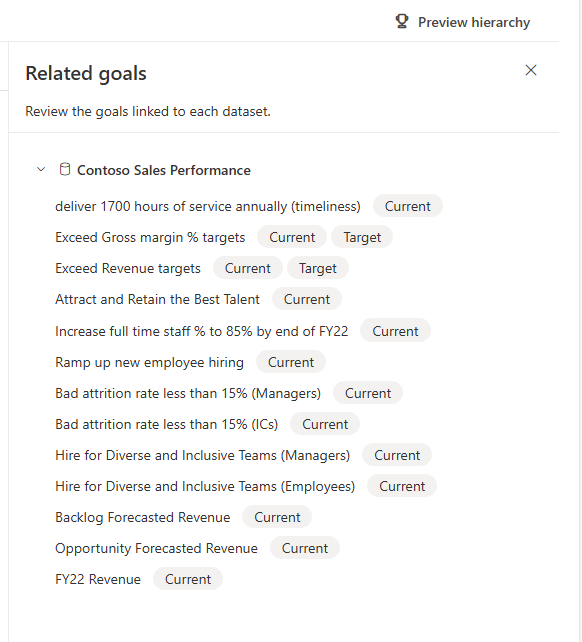
También hay una opción en la esquina superior derecha para ver las métricas relacionadas, en la que se muestra información general de las métricas en el cuadro de mandos, qué valores están conectados a los datos y del modelo semántico del que proceden.
Propietarios de mapas
Puede asignar propietarios en la sección Asignar propietarios para que la columna propietario cambie dinámicamente con cada segmento de los datos. Los propietarios se asignan por jerarquía, por lo que para que una asignación de propietario funcione correctamente, debe haber una relación entre el campo propietario y los datos de jerarquía en los modelos semánticos subyacentes. Las asignaciones de propietario se aplican por nivel de jerarquía, no por métrica.
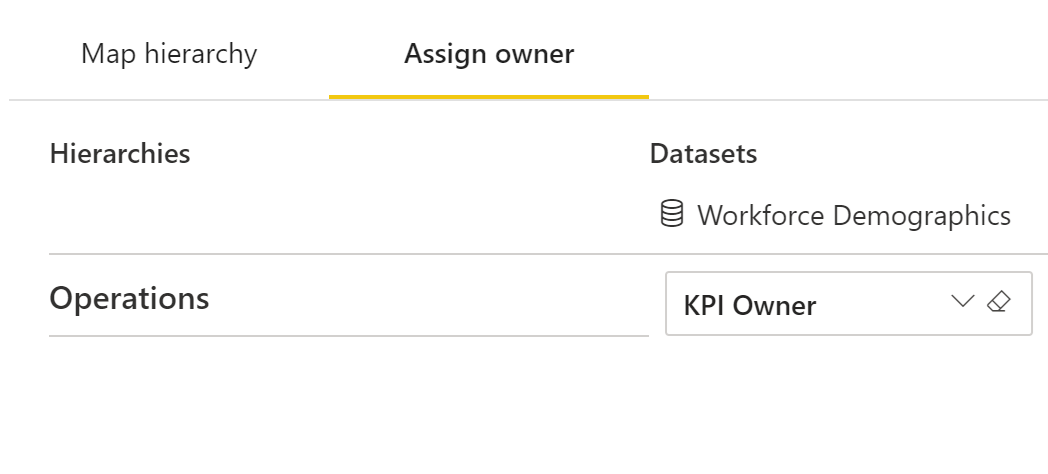
Guarde la jerarquía y observe cómo cambian dinámicamente todos los valores y propietarios conectados. Las jerarquías admiten objetivos manuales (objetivos no conectados a datos) y – los objetivos manuales se muestran en cuadros de mandos secundarios, pero muestran los valores manuales como en blanco. Estos objetivos se pueden activar y actualizar en las vistas del cuadro de mandos secundario.
Otros datos de métrica heredados del cuadro de mandos original:
- Metadatos de métricas: nombre, propietarios, estados e fechas de inicio y vencimiento
- Conexiones de datos
- Reglas de estado
- Configuración de seguimiento
Datos de métricas que se pueden editar en cuadros de mandos secundarios:
- Datos de comprobación: notas, estados cuando corresponda y valores cuando corresponda.
Consideraciones y limitaciones
Hay límites de datos en jerarquías:
- Hasta 10 000 elementos por jerarquía (en todos los modelos semánticos)
- Hasta cinco jerarquías
- Hasta cinco niveles por jerarquía
Se admite la seguridad de nivel de fila dinámica y estática (RLS), pero se enruta a través del creador de la jerarquía. Todos los visores de cuadros de mandos suplantan el acceso del creador de la jerarquía.
Otros usuarios con acceso de edición al cuadro de mandos pueden editar la jerarquía, pero sus cambios se harán cargo de las conexiones de jerarquía al guardar, así como de todos los datos. Las conexiones se enrutan a través de su UserID, lo que puede dar lugar a valores de datos diferentes o métricas rotas.
Todavía no se admite la reutilización de jerarquías de Power BI. Debe crear jerarquías en cada cuadro de mandos.
Para que las jerarquías reflejen los cambios adecuados, debe tener relaciones establecidas entre los campos de jerarquía de los datos subyacentes. Esto también es cierto para los propietarios.
Las jerarquías no se incluyen en el modelo semántico del cuadro de mandos.
Los propietarios asignados en la jerarquía no reciben automáticamente permisos en el cuadro de mandos.
Los propietarios se aplican por nivel de jerarquía, no por métrica.
Los paquetes acumulativos aún no se admiten en cuadros de mandos secundarios.
