Application capability profiler (ACP)
Packaged applications may need to access resources outside of the sandbox. Examples of such resources include user files, pictures, registry items, camera, location, and microphone, among others. Capability declaration allows sandboxed applications to access some of those resources. Declarations are made in the sandboxed application's package manifest. See msix-packaging-tool for reference.
Application capability profiler is a set of tools that help identify what capabilities may need to be declared by an application package, so it's granted the resource access it needs. Furthermore, it provides useful diagnostic information on failed access attempts by the application package.
Important
This feature is in preview: Some information relates to a prerelease product which may be substantially modified before it's commercially released. Microsoft makes no warranties, express or implied, with respect to the information provided here.
Prepare the target system for profiling
The follow steps are required to set up the target system for profiling:
Ensure your user account has administrator privilege to the target Windows system.
Enable developer mode on the target system. This setting can be found in Windows Settings | Privacy & security | For developers. See Enable your device for development for more information.
Install PowerShell 7.3 or later. See Installing PowerShell on Windows for installation instructions.
This is required for Microsoft.Windows.Win32Isolation.ApplicationCapabilityProfiler module compatibility.
Install Windows Performance Recorder (WPR) if not already installed and add it to PATH.
See Windows Performance Recorder for instructions.
Get-Command wpr
Download the application capability profiler archive and extract it to a convenient path.
The application capability profiler archive can be downloaded from this project's release assets.
Follow the instructions on Package isolated Win32 apps with Visual Studio to package the application and install it on the target system.
Obtain the target application package manifest (recommended) and/or the target application package full name.
(Recommended) Obtain the target application package manifest. The easiest way to do this is to open it using Visual Studio and save a copy of the manifest to a convenient path.
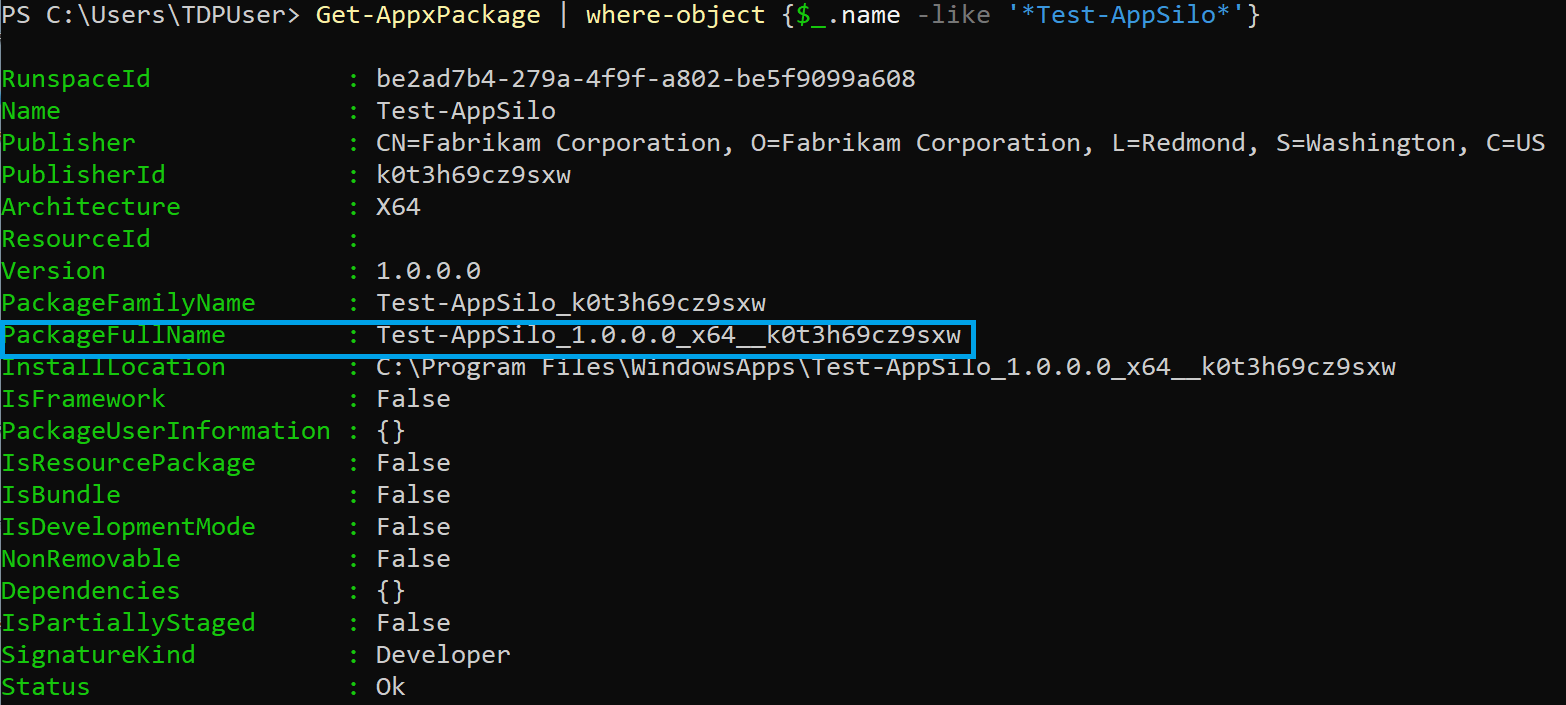
Obtain the application package full name by running the following command in PowerShell:
Get-AppxPackage | where-object {$_.name -like '*Test-AppSilo*'}
(Optional) Install the Windows Performance Analyzer. See Windows Performance Analyzer for instructions. This is not required for profiling but may be helpful in visualizing some of the data captured and output by ACP.
Import the PowerShell module
Information about the module can be found here: Microsoft.Windows.Win32Isolation.ApplicationCapabilityProfiler.
Run the following command in PowerShell with administrator privileges to import the module:
Import-Module .\Microsoft.Windows.Win32Isolation.ApplicationCapabilityProfiler.dll
Note
The Microsoft.Windows.Win32Isolation.ApplicationCapabilityProfiler.dll module is located in the ACP folder extracted from the archive in step 5 of the Prepare the target system for profiling instructions above.
Start profiling
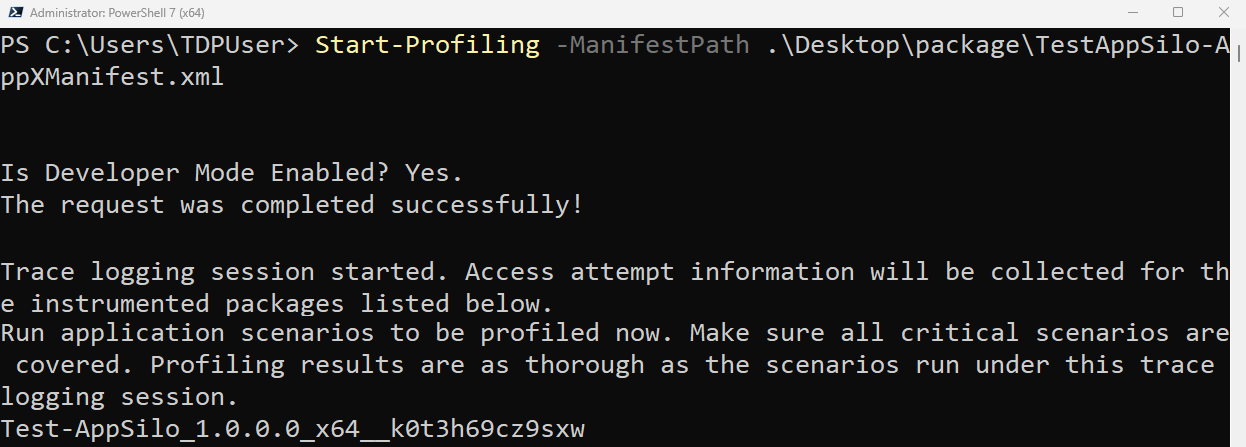
The Start-Profiling cmdlet takes the path to the target application package manifest or the full name of the application package.
Start-Profiling will instrument the target application package for trace logging and enable a trace logging provider for access attempts made by the target application package. See Start-Profiling for more information.
Run the following command in PowerShell with administrator privileges to start profiling:
Start-Profiling -ManifestPath TestApp-AppXManifest.xml

Run the application scenarios
In this step, it is important that all the critical application scenarios are run. Profiling results are as comprehensive as the scenarios run at this step. The more application scenarios are exercised, the larger and more complete the amount of data captured by the trace logging session started above.
Stop profiling
The Stop-Profiling cmdlet stops an access attempt trace logging session that has been started and removes the instrumentation for any application packages that were instrumented for trace logging.
Stop-Profiling accepts an optional trace path parameter that controls the path used for the output Event Trace Log (.etl) file. <current_directory>\trace.etl by default. See Stop-Profiling for more information.
Run the following command in PowerShell with administrator privileges to stop profiling:
Stop-Profiling

Get the profiling results
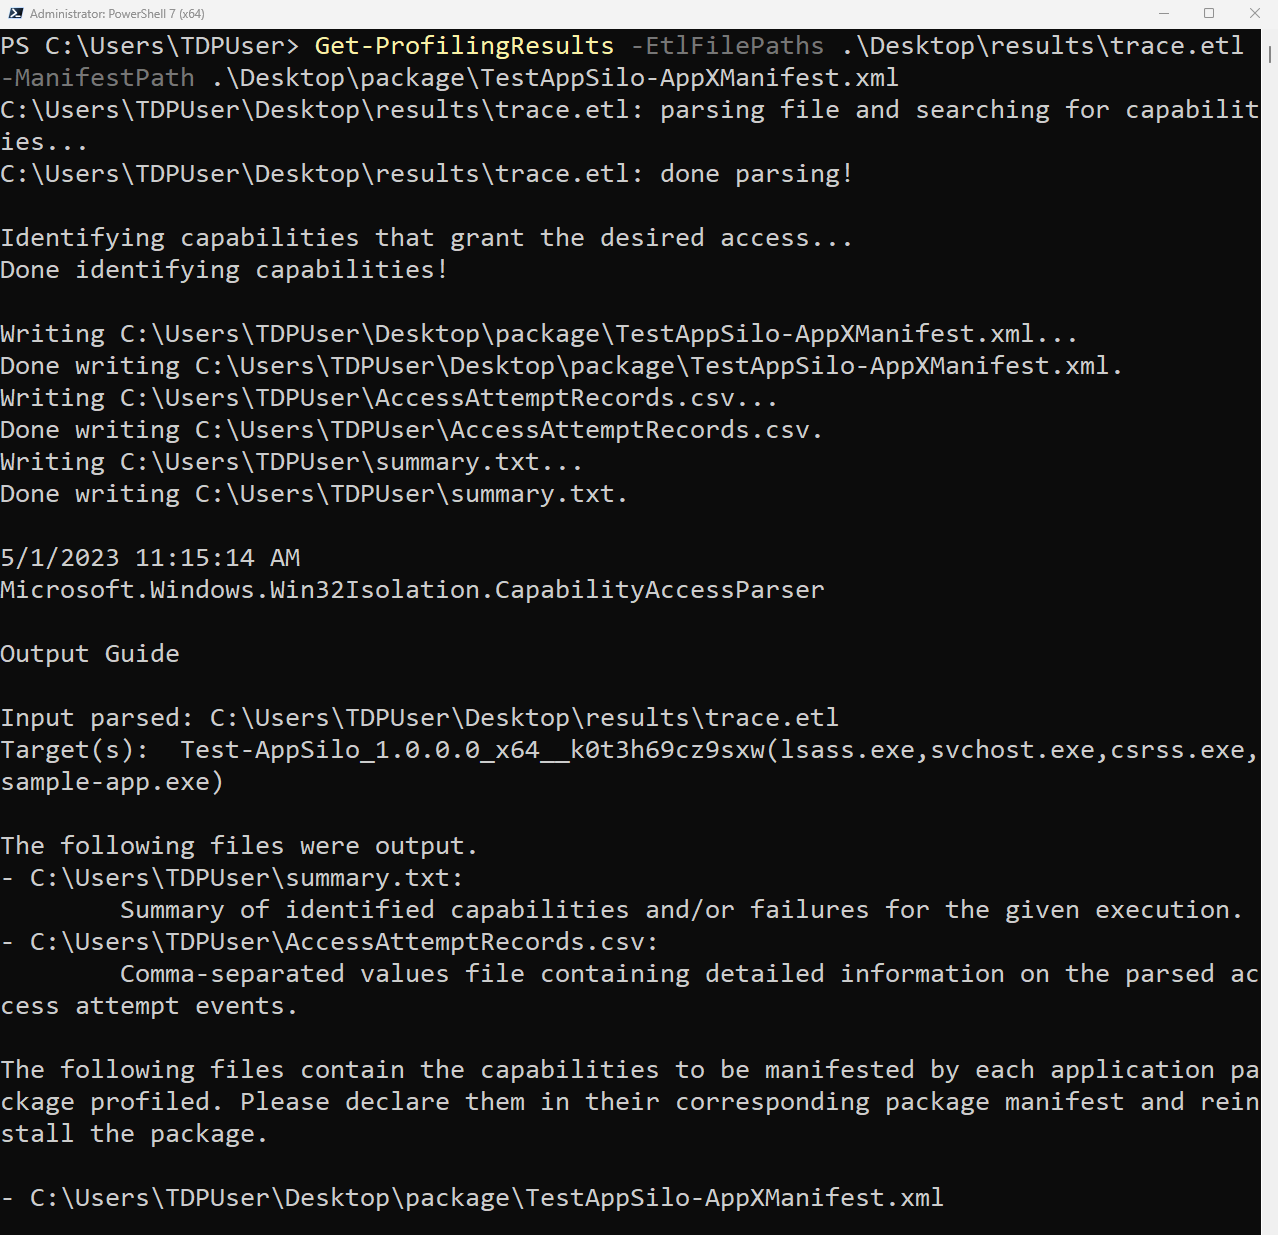
The Get-ProfilingResults cmdlet parses the trace file obtained from the steps above and finds the capabilities required by the application package(s) identified in the trace. It outputs the capabilities and information for every application package identified in the trace, unless filters to a specific package were specified.
Get-ProfilingResults accepts the path to the trace file to be parsed. If no path is provided, Get-ProfilingResults will attempt to invoke Stop-Profiling to obtain a trace to parse.
Get-ProfilingResults optionally takes a path to a target application manifest. If information in the parsed trace can be attributed to the target application package manifest, the file is edited directly with the output capabilities. Otherwise, a copy of the manifest is made for each of the packages identified in the trace, adding the identified capabilities.
See Get-ProfilingResults for details.
The following command will parse the trace file and output the results:
Get-ProfilingResults -EtlFilePaths trace.etl -ManifestPath TestApp-AppXManifest.xml

Repackaging the app
To repackage the target application with the newly identified capabilities:
- Include the newly identified capabilities in the target application package manifest (Get-ProfilingResults will edit the manifest directly if provided).
- Follow instructions in Package isolated Win32 apps with Visual Studio to repackage the target application with the new capabilities, and reinstall it.
Helper cmdlets
The Merge-ProfilingResults cmdlet can be used to merge the output from multiple runs of Get-ProfilingResults.
Interpreting the profiling output
The output of Get-ProfilingResults consists of the following:
Manifest-formatted capabilities
If the user provides a manifest to be edited with the
-ManifestPathswitch and the package to which the manifest belongs is identified in the input trace, Get-ProfilingResults will edit the manifest file directly to include the capabilities identified in the trace for the package. Otherwise, for each package identified in the trace file, Get-ProfilingResults will output a file named<package full name><manifest name>.xmlcontaining the<Capabilities>element with the capabilities identified in the trace for the corresponding package.Note
There are two special kinds of capabilities that Get-ProfilingResults may identify. These results are flagged with XML comments in the output manifest.
- Privacy-sensitive capabilities: These capabilities protect privacy-sensitive resources such as camera, location, and microphone. These capabilities must be declared if the application package requires access to these resources. However, capability declaration alone may not be sufficient to ensure application access to the target privacy-sensitive resource. In privacy settings, the user can still grant or deny resource access to the application.
- Prompting capability: Get-ProfilingResults will output this capability in "commented-out" form when it identifies that the prompting capability may apply to an application package. If declared in the package manifest, the application is opted into fallback prompting. User prompts will be issued every time the application has its access denied to a prompting-eligible resource. This gives the user a chance to explicitly grant or deny access to the resource. Fallback prompting can be intrusive and weaken the sandbox, so it should be used with caution, preferably only when required for critical application scenarios.
AccessAttemptRecords.csv
This is a comma-separated values file containing detailed diagnostic information about parsed trace events and each failed access attempt logged for the application package.
summary.txt
This is a summary of all runs of Get-ProfilingResults. Each run appends to this file.
-SummaryOutputPathcan be used to modify this filepath.The summary contains the inputs parsed, target application packages and executables, identified capabilities, edited manifest contents, and a summarized list of all the resources that the application package attempted to access but for which no capabilities were identified.
Note
It's possible that the target application won't be able to access these resources when packaged.
README.txt
This file contains information for all runs of Get-ProfilingResults. Each time the script runs, it appends to this file.
The README provides information about the input parsed, target application package, files output and their paths, as well as a troubleshooting guide.
Stack tracing
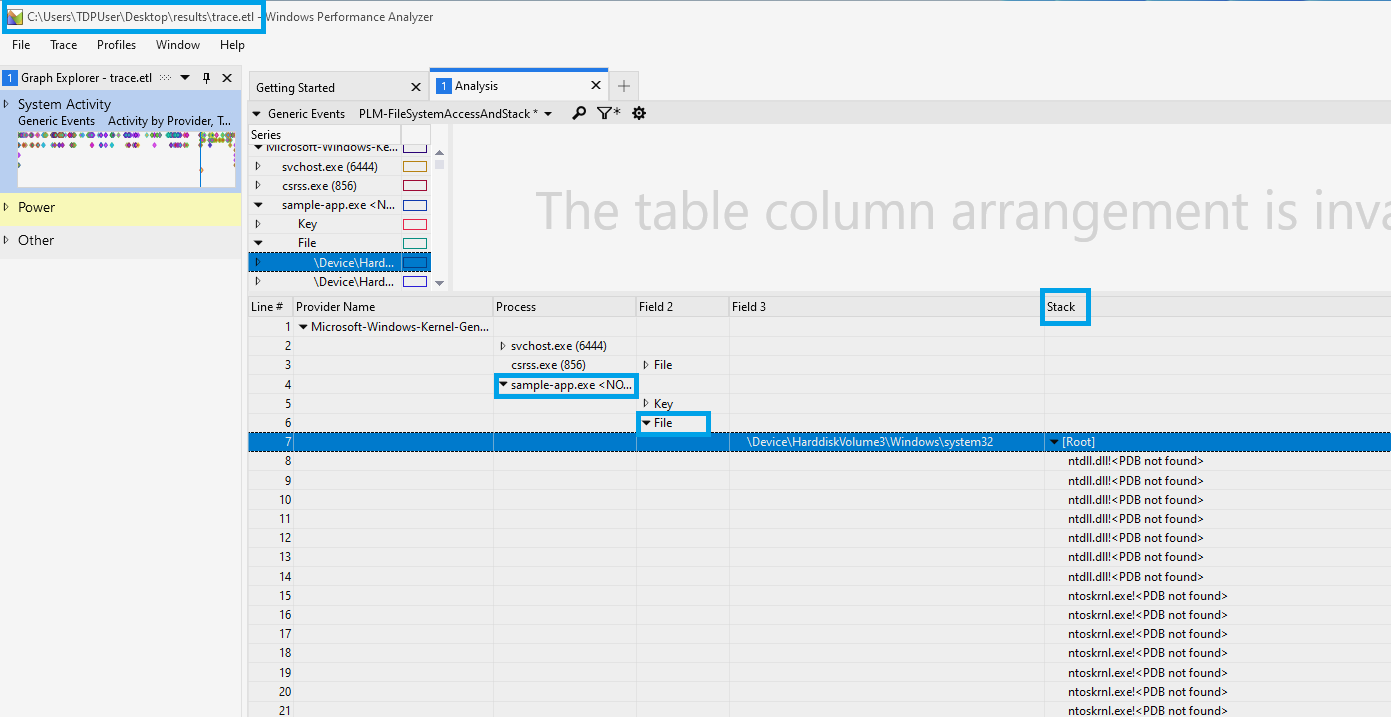
The ACP archive contains a file named ACP-StackTrace.wpaProfile. This is a profile for Windows Performance Analyzer (WPA). It enables stack trace visualization for the event trace log file captured by Stop-Profiling. It breaks down access attempts, their target, and the stack that issued the attempt. This enables a more complete understanding of the reasons why the target application is not able to access specific resources.
To visualize access attempt stacks captured by Stop-Profiling in trace.etl:
Open the trace.etl file in WPA.
Configure the WPA Symbol paths to point to the application symbols and the Microsoft public symbol server:

Load the symbols.
Apply the profile in ACP-StackTrace.wpaProfile to view the access attempt stack visualization:


Related topics
Microsoft.Windows.Win32Isolation.ApplicationCapabilityProfiler