Cluster values
Cluster values automatically create groups with similar values using a fuzzy matching algorithm, and then map each column's value to the best-matched group. This transform is useful when you're working with data that has many different variations of the same value and you need to combine values into consistent groups.
Consider a sample table with an id column that contains a set of IDs and a Person column containing a set of variously spelled and capitalized versions of the names Miguel, Mike, William, and Bill.
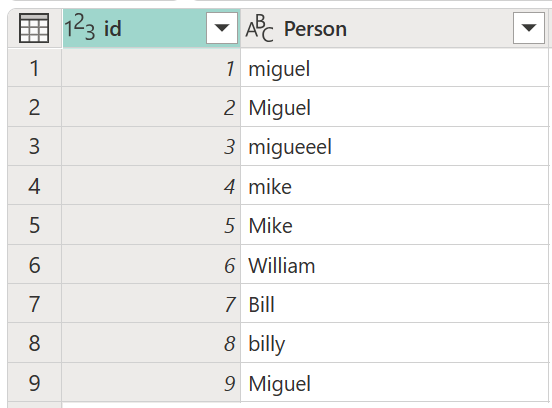
In this example, the outcome you're looking for is a table with a new column that shows the right groups of values from the Person column and not all the different variations of the same words.
Note
The Cluster values feature is available only for Power Query Online.
Create a Cluster column
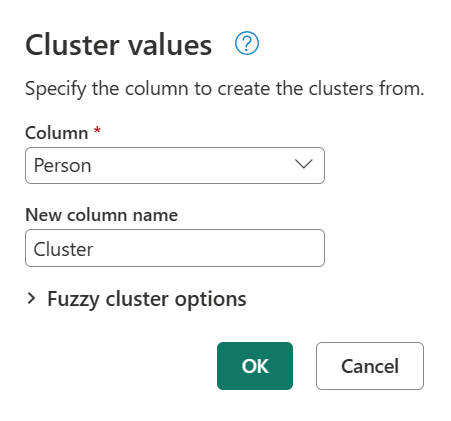
To cluster values, first select the Person column, go to the Add column tab in the ribbon, and then select the Cluster values option.
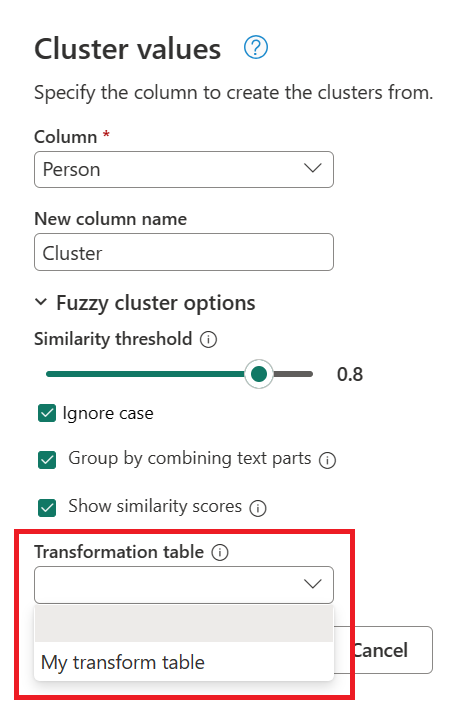
In the Cluster values dialog box, confirm the column that you want to use to create the clusters from, and enter the new name of the column. For this case, name this new column Cluster.
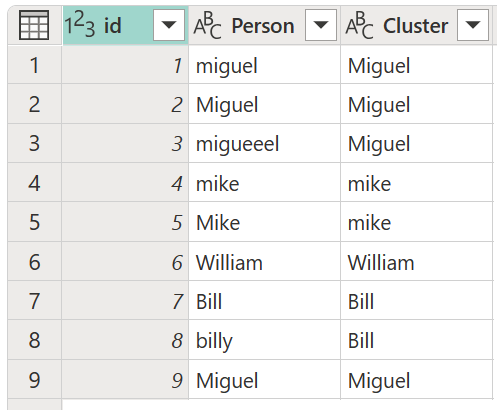
The result of that operation is shown in the following image.

Note
For each cluster of values, Power Query picks the most frequent instance from the selected column as the "canonical" instance. If multiple instances occur with the same frequency, Power Query picks the first one.
Using the fuzzy cluster options
The following options are available for clustering values in a new column:
- Similarity threshold (optional): This option indicates how similar two values must be to be grouped together. The minimum setting of zero (0) causes all values to be grouped together. The maximum setting of 1 only allows values that match exactly to be grouped together. The default is 0.8.
- Ignore case: When text strings are compared, case is ignored. This option is enabled by default.
- Group by combining text parts: The algorithm tries to combine text parts (such as combining Micro and soft into Microsoft) to group values.
- Show similarity scores: Shows similarity scores between the input values and computed representative values after fuzzy clustering.
- Transformation table (optional): You can select a transformation table that maps values (such as mapping MSFT to Microsoft) to group them together.
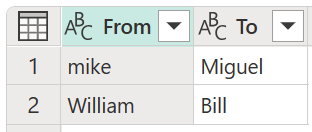
For this example, a new transformation table with the name My transform table is used to demonstrate how values can be mapped. This transformation table has two columns:
- From: The text string to look for in your table.
- To: The text string to use to replace the text string in the From column.
Important
It's important that the transformation table has the same columns and column names as shown in the previous image (they have to be named "From" and "To"), otherwise Power Query won't recognize this table as a transformation table, and no transformation will take place.
Using the previously created query, double-click the Clustered values step, then in the Cluster values dialog box, expand Fuzzy cluster options. Under Fuzzy cluster options, enable the Show similarity scores option. For Transformation table (optional), select the query that has the transform table.
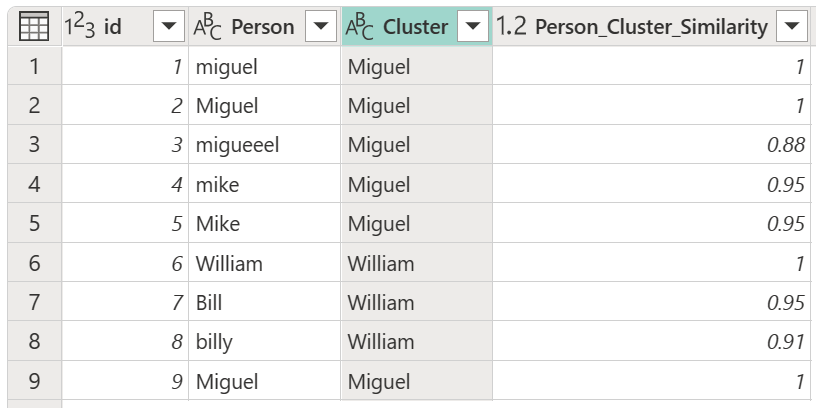
After selecting your transformation table and enabling the Show similarity scores option, select OK. The result of that operation gives you a table that contains the same id and Person columns as the original table, but also includes two new columns called Cluster and Person_Cluster_Similarity. The Cluster column contains the properly spelled and capitalized versions of the names Miguel for versions of Miguel and Mike, and William for versions of Bill, Billy, and William. The Person_Cluster_Similarity column contains the similarity scores for each of the names.
Transformation table precepts
You might notice that the transformation table in the previous section appeared to indicate that instances of Mike are changed to Miguel and instances of William are changed to Bill. However, in the resulting table, the instances of Bill and "billy" were instead changed to William. In the transformation table, rather than being a direct From to To path, the transformation table is symmetric during clustering, meaning that "mike" is equivalent to "Miguel" and vice versa. The result of the equivalents given in the transformation table depends on the following rules:
- If there's a majority of identical values, these values take precedence over nonidentical values.
- If there's no majority of values, the value that appears first takes precedence.
For example, in the original table used in this article, versions of Miguel (both "miguel" and Miguel) in the Person column make up the majority of instances of the name Miguel and Mike. In addition, the name Miguel with initial caps makes up the majority of the name Miguel. So associating Miguel and its derivatives and Mike and its derivatives in the transform table results in the name Miguel being used in the Cluster column.
However, for the names William, Bill, and "billy", there's no majority of values since all three are unique. Since William appears first, William is used in the Cluster column. If "billy" had appeared first in the table, then "billy" would be used in the Cluster column. Also, because there's no majority of values, the case used by the individual names is used. That is, if William is first, William with an upper case "W" is used as the result value; if "billy" is first, "billy" with a lower case "b" is used.