View and explore metrics
This article shows you different methods to view, explore, and analyze metrics within Power BI. Methods include using the metric details, usage sections, and the Explore feature for in-depth analysis. You also learn the importance of metric details and how they provide better understanding and trustworthiness the metrics.
Metric details
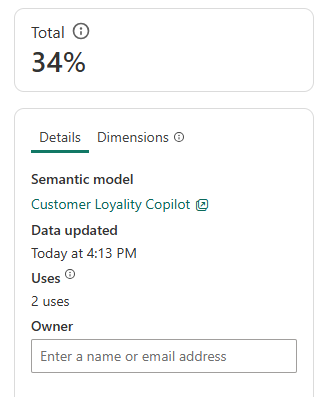
It’s important to understand how to navigate the Metric details section. The Metric details section includes the following details:
- Metric Value
- Semantic model
- Data updated
- Uses
- Owner

The metric value itself is located above the other details. The metric value includes the time period or aggregation specified in the measure logic, or the metric value shows a grand total value as in the image in the Total box. The Semantic model detail contains the underlying measure. The Data updated detail shows when the semantic model data was last updated. The Uses detail shows the number of uses for this metric or how many times someone used this metric in a report. The Owner detail gives a point of contact for viewers. Views can use this point of contact to ask questions, request changes to the metric dimensions, etc.
Usage section
Users can also use the Usage section of a metric page, which is linked to the Uses section in the details area. This section displays the specific downstream applications of a metric. For example, if a metric (or its underlying measure) is used in 10 reports, all 10 reports appear in this table.

This section is important for several reasons:
- Lineage: Metric authors can track how their metric is being used, which helps determine if any adjustments are needed. Additionally, a lineage view is available for more detailed insights.
- Trust: For viewers, the usage section serves as a valuable trust indicator. If there are two metrics with similar names, the one with more usages and recognizable downstream reports is likely the more reliable metric.
- Navigation: It facilitates easy navigation to downstream solutions, enabling users to explore further analysis and applications of the metric.
Note
Usage table respects permissions.
Metric Analysis
Metrics are versatile. You can view the metric directly in the metric details page and begin analysis with the provided visuals and Copilot summaries and details, without performing any extra action. Users can also select the Dimensions section on the Metric details page to see the available dimensions for a metric. Users can favorite metric sets they use often, so that they can always come back and get the most up-to-date number.
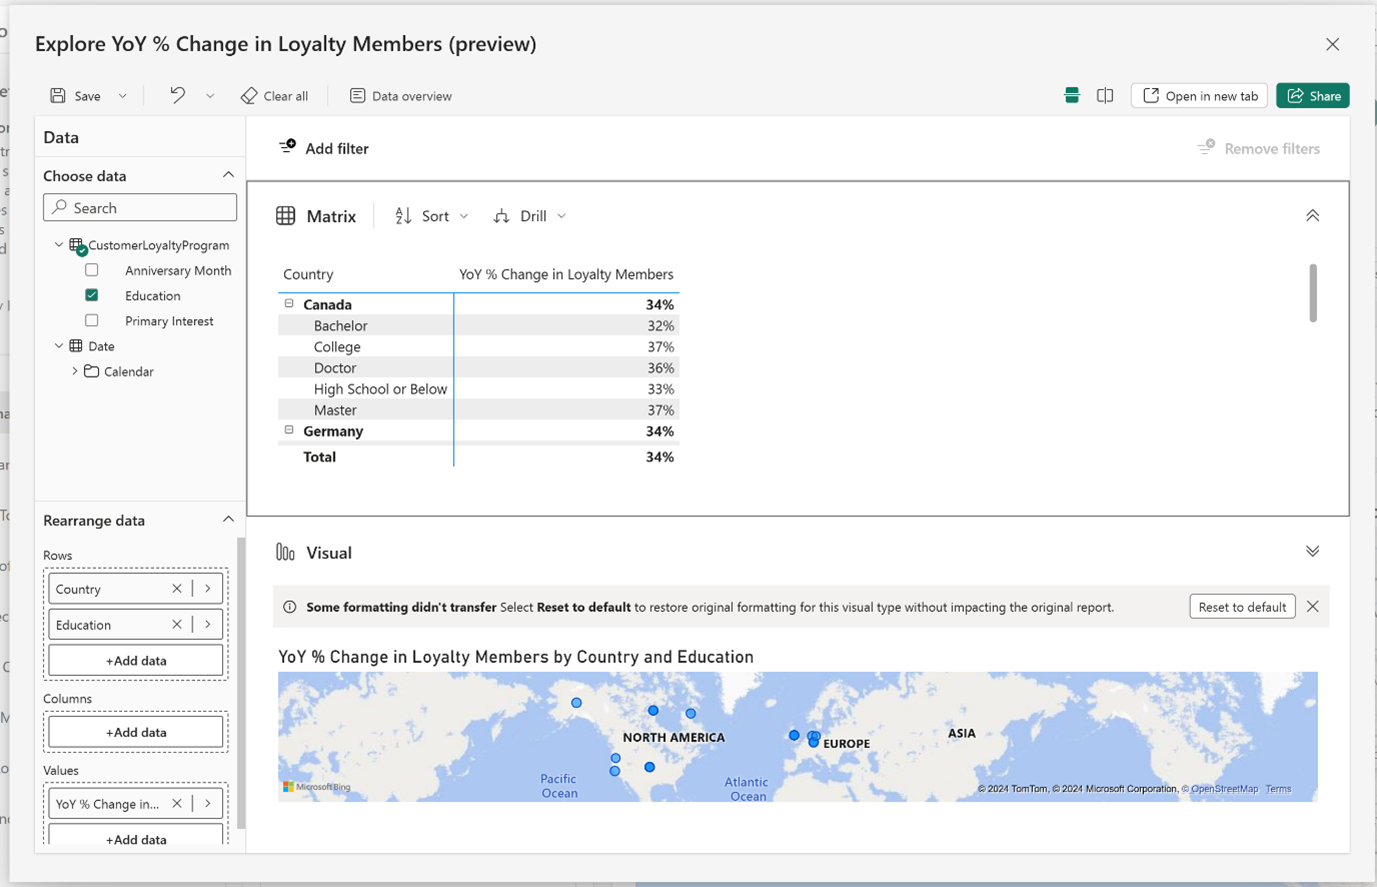
If there are views or specific groupings users want to see from the dimensions list that aren't yet visualized in the preview area, users can use the Explore feature. To access Explore, select Explore from the action buttons, then manipulate your data to get the correct view you need.

When you view the Explore area, the data pane only displays the metric and its associated dimensions. This setup provides a controlled exploration experience, to make sure that users can only slice the metric by dimensions that are relevant and appropriate. The setup also prevents the use of unrelated or unsuitable dimensions. You can save your analysis as an exploration or as a report.