Use and monitor metrics
There are methods for report authors and data scientists to use these metrics. Them methods make sure creators consistently use the most accurate and trusted KPIs within their organization, designed for reuse and wide distribution. Reports built on these metrics benefit from higher data quality, as they use standardized and validated KPIs. Data scientists can now incorporate these reliable metrics directly into their complex models without needing to reverse engineer data. Through Sempy integration, they can easily access and reuse the metrics defined in the Power BI semantic model.
This article shows you how to use metrics in reports and notebooks. Also how to make sure accurate and trusted KPIs are used within your organization for higher data quality and simplified integration into complex models.
Use in a report
To use in a report:
Select the use metric dropdown
Select use in report
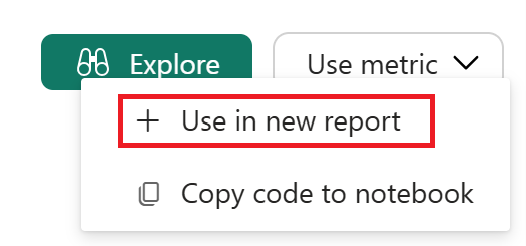
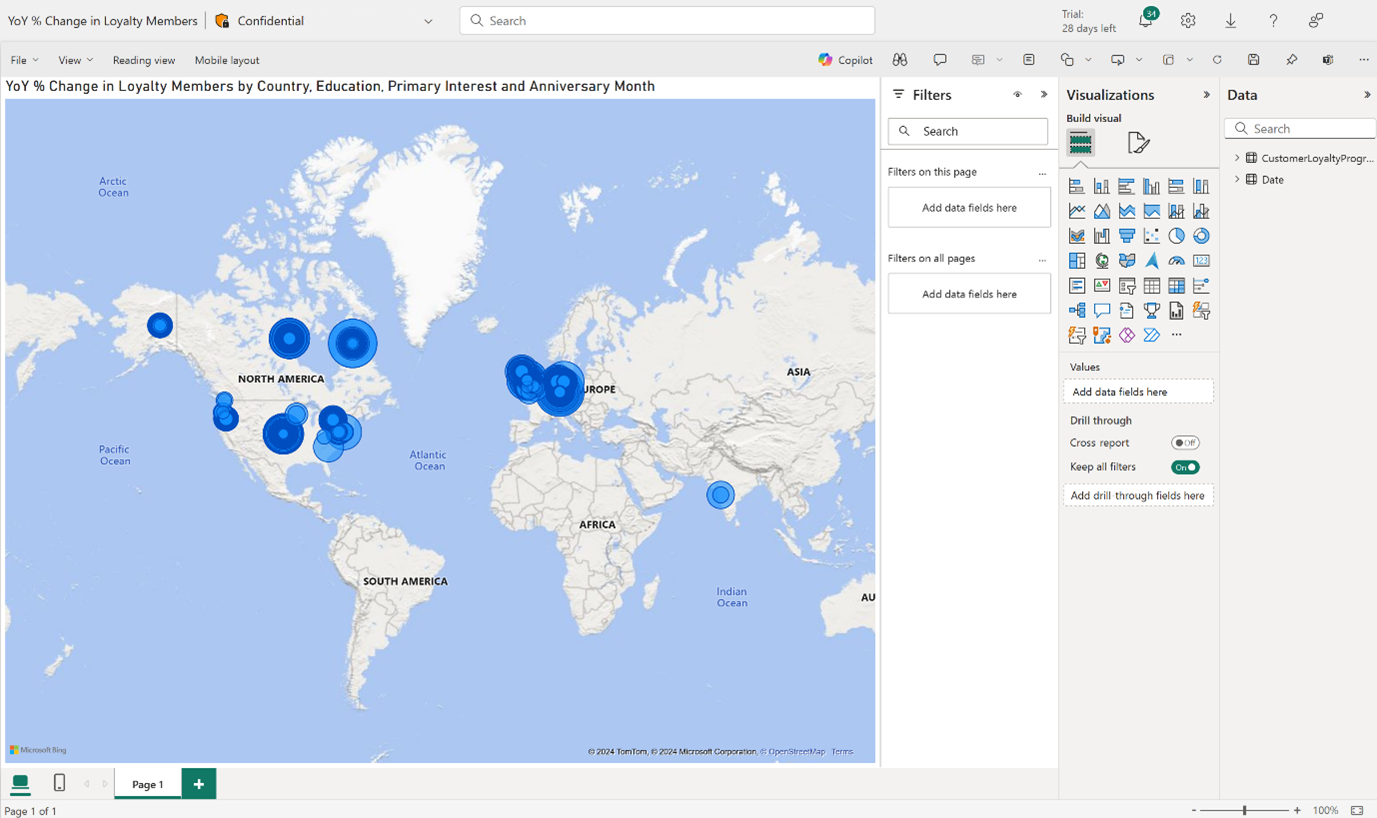
Add data sources and build your report solution
Note
For all report authoring scenarios, connecting to a metric currently brings the entire semantic model into the data pane. In the future the data pane will only show the metric and its related dimensions.
Use in Notebooks
Using data outside of Power BI is a powerful experience in the metrics layer. Use a metric to generate a code snippet, using SemPy + semantic link. Use this code snippet to use the metric in Notebooks or other python environments.
- Select the use metric dropdown.
- Select copy code to notebook.
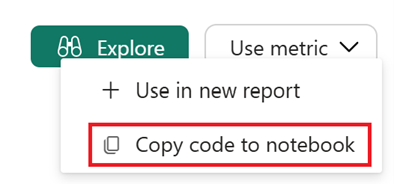
- Copy the code snippet provided.

- Navigate to a new or existing notebook.
- Paste the code snippet into a cell.
- Include groupby additions to include specific dimensions (optional step).
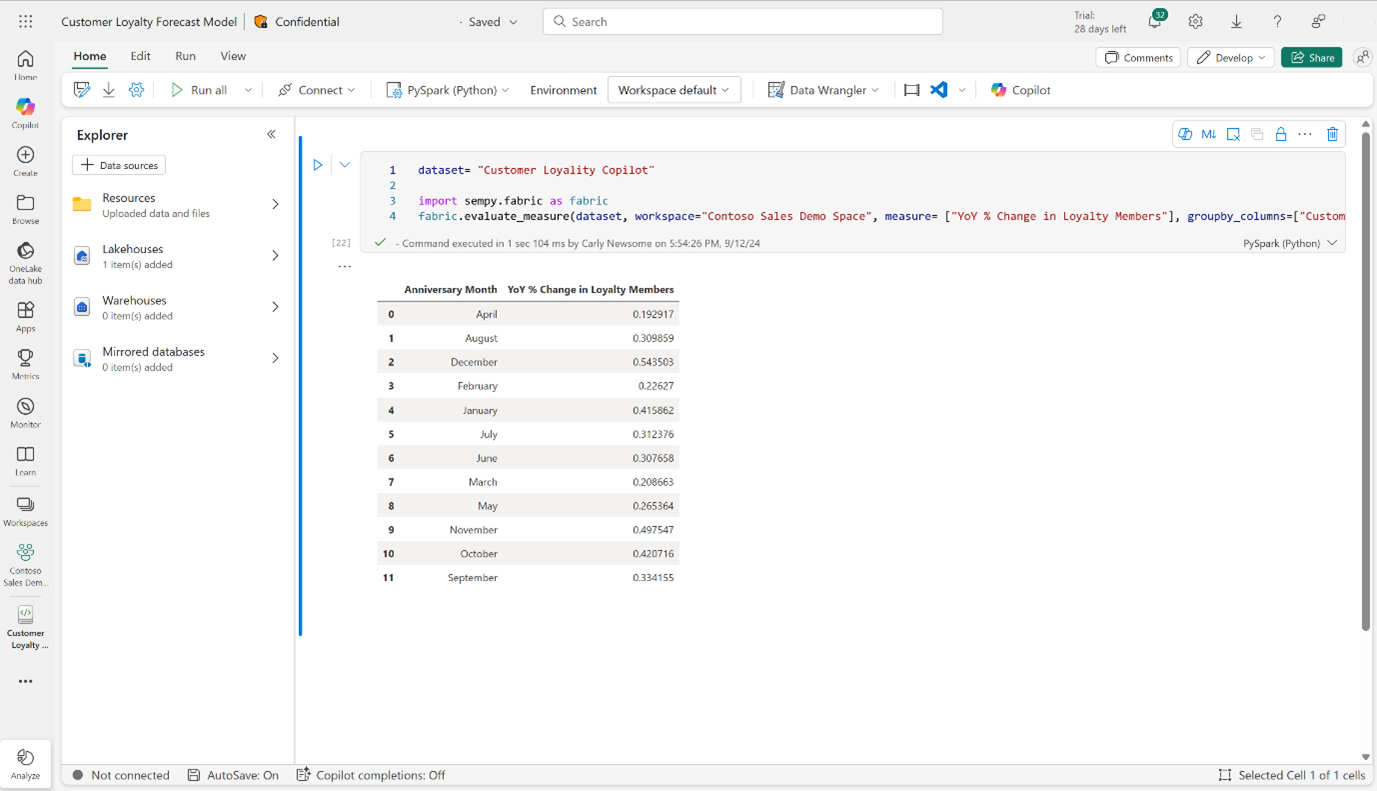
- Run the cell and produce a dataframe.
You can save this back to your lakehouse so that the data is accessible outside of Power BI.
Use with APIs
Metric sets are Fabric artifacts, so you can use the public APIs for Fabric artifacts. The APIs use the metric set metadata. However, Metric sets are made up of individual metrics, which aren't accessed via the public Fabric APIs. For more information, read Microsoft Fabric REST API references.
To use metric data via API, you can use semantic link, and use SemPy, which is a python library that simplifies working with semantic data. You can use SemPy, which uses elements of APIs, to connect to a Power BI Measure that powers a metric. You can access a pregenerated code snippet in the use in notebook section of the metric details page. For more information, read Use in notebooks for more information.
Understand lineage
In Power BI, the lineage view is essential for creators. The lineage view offers visibility into data flow, supports impact analysis, aids in troubleshooting, enforces data governance, optimizes performance, enhances collaboration, and provides documentation. This comprehensive understanding is critical for maintaining the accuracy, efficiency, and effectiveness of data-driven projects.
Metric sets show up in both workspace lineage views and data lineage views:
- Workspace Lineage View: Focuses on the relationships between items within a specific Power BI workspace, helping users understand how different components are interconnected.
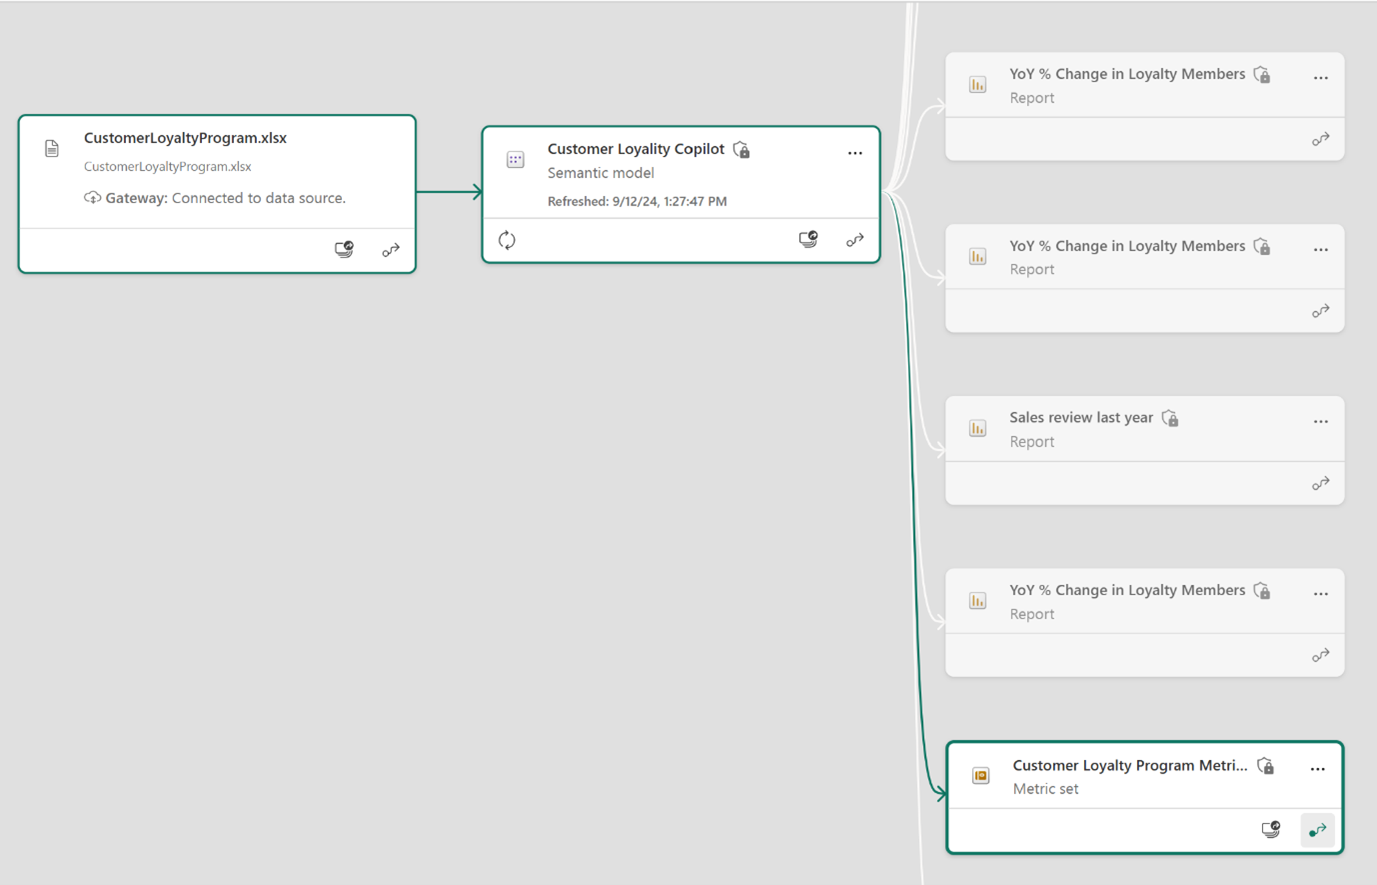
- Data Lineage View: Provides an end-to-end view of how data is sourced, transformed, and used in reports and dashboards, covering the entire data lifecycle.
There are a couple other ways for creators to understand lineage and usage of a metric:
- Usage section: Users can also utilize the Usage section of a metric page, which is linked to the Uses section in the details area. This section displays the specific downstream applications of a metric. For example, if a metric (or its underlying measure) is used in 10 reports, all 10 reports appear in this table.

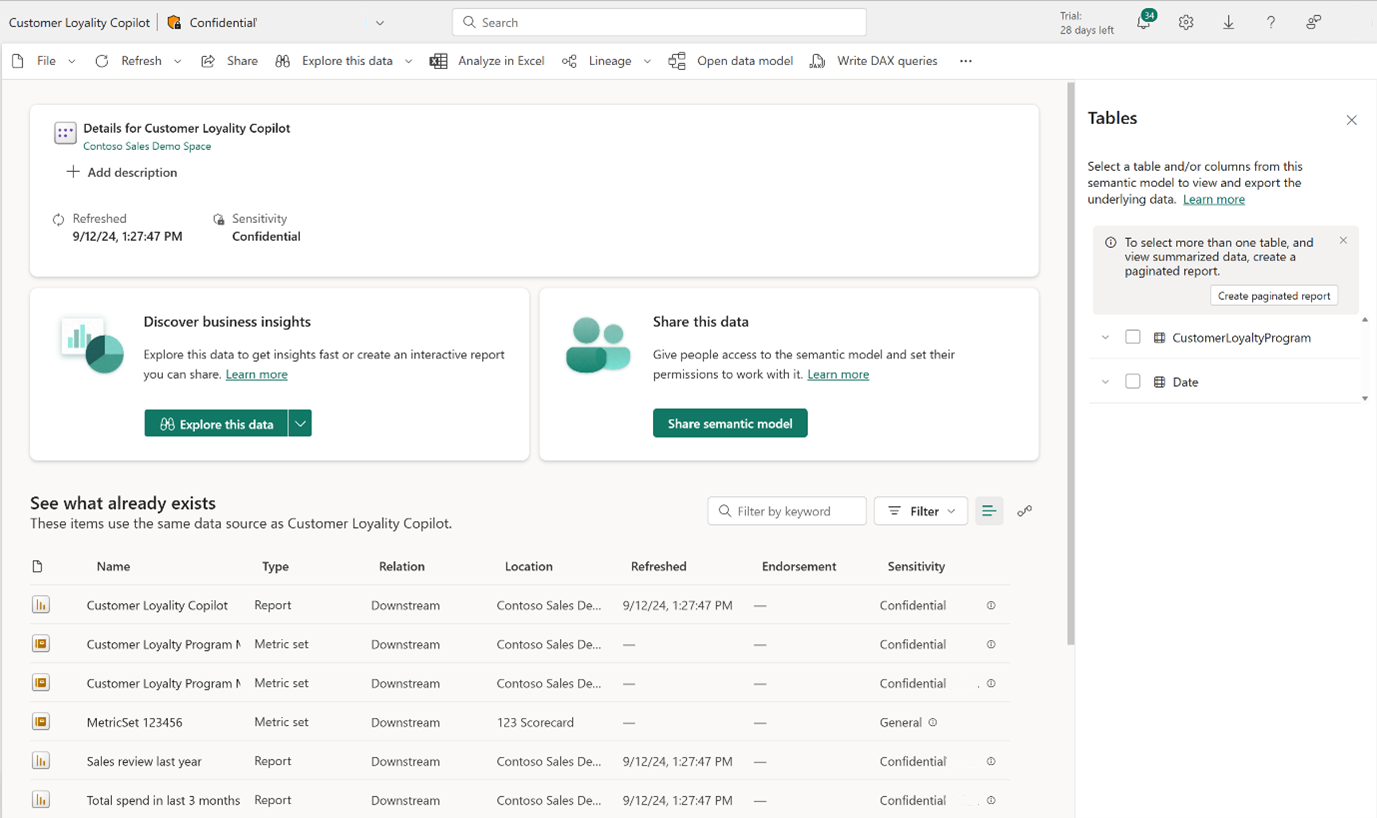
- Details page for semantic model: Metric set artifacts show up in the See what already exists table for a specific semantic model if a metric uses a measure located in that model.
