Introduction to dashboards for Power BI designers
APPLIES TO:
Power BI Desktop
Power BI service
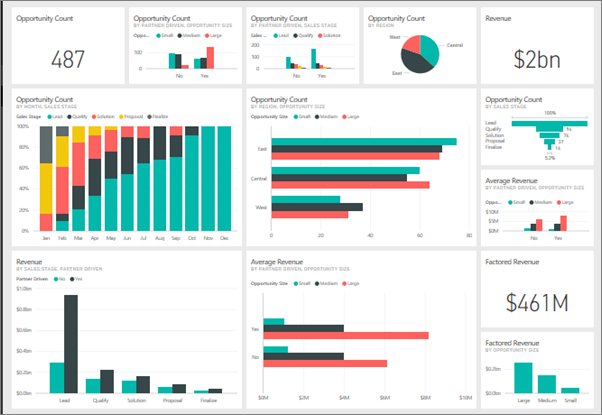
A Power BI dashboard is a single page, often called a canvas, that tells a story through visualizations. Because it's limited to one page, a well-designed dashboard contains only the highlights of that story. Readers can view related reports for the details.

Dashboards are a feature of the Power BI service. They're not available in Power BI Desktop. You can't create dashboards on mobile devices, but you can view and share them there.
Dashboard basics
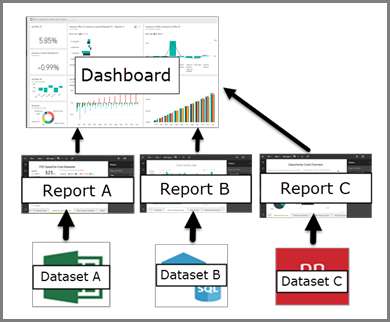
The visualizations you see on the dashboard are called tiles. You pin tiles to a dashboard from reports, and each report is based on a semantic model. A dashboard is an introduction to the underlying reports and semantic models. Selecting a visualization takes you to the report and semantic model that it's based on. If you're new to Power BI, see Basic concepts for designers in the Power BI service.

You can pin many kinds of tiles to dashboards:
- Pin a tile from a report.
- Pin a tile from another dashboard.
- Pin a tile from Excel.
- Create a tile in Q&A and pin it.
- Pin an entire report page.
- Add images, videos, and more to a dashboard.
Advantages of dashboards
Dashboards are a way to monitor your business and see all your most important metrics at a glance. The visualizations on a dashboard can come from one underlying semantic model or many, and from one underlying report or many. A dashboard combines on-premises and cloud data, providing a consolidated view of data.
A dashboard isn't just a pretty picture. It's highly interactive, and the tiles update as the underlying data changes.
Who can create a dashboard?
The ability to create a dashboard is considered a creator feature and requires edit permissions on the report. Edit permissions are available to report creators and to colleagues the creator grants access to. For example, if a coworker creates a report in workspace ABC and adds you as a member of that workspace, you and your coworker both have edit permissions. On the other hand, if a report is shared with you directly or as part of a Power BI app, you're consuming the report. You may not be able to pin tiles to a dashboard.
Important
You need a Power BI Pro or Premium Per User (PPU) license to create dashboards in workspaces. You can create dashboards in your own My Workspace without a Power BI Pro or Premium Per User (PPU) license.
Dashboards versus reports
Reports and dashboards seem similar because they're both canvases filled with visualizations, but there are major differences, as you can see in the following table.
| Capability | Dashboards | Reports |
|---|---|---|
| Pages | One page | One or more pages |
| Data sources | One or more reports and one or more semantic models per dashboard | A single semantic model per report |
| Drilling down in visuals | Only if you pin an entire report page to a dashboard. | Yes |
| Available in Power BI Desktop | No | Yes. You can build and view reports in Power BI Desktop. |
| Filtering | No. You can't filter or slice a dashboard. You can filter a dashboard tile in focus mode, but can't save the filter. | Yes. There are many different ways to filter, highlight, and slice. |
| Feature content on colleagues' Home page | Yes | Yes |
| Favorites | Yes. You can set multiple dashboards as favorites. | Yes. You can set multiple reports as favorites. |
| Natural language queries (Q&A) | Yes | Yes, provided you have edit permissions for the report and underlying semantic model. |
| Set alerts | Yes. Available for dashboard tiles in certain circumstances. | No |
| Subscribe | Yes. You can subscribe to a dashboard. | Yes. You can subscribe to a report page. |
| See underlying semantic model tables and fields | No. You can't see tables and fields in the dashboard itself, but you can export data. | Yes |
Related content
- Get comfortable with dashboards by taking a tour of one of the sample dashboards.
- Learn about dashboard tiles.
- Want to track an individual dashboard tile and receive an email when it reaches a certain threshold? Create an alert on a tile.
- Learn how to use Power BI Q&A to ask a question about your data and get the answer in the form of a visualization.