Analyze topic usage in Copilot Studio
The topic analytics pane provides a view into the performance of an individual topic and how it can be improved.
To display the topic analytics pane, select the Detail link for the topic in one of the following charts on the Summary or Customer Satisfaction tabs:
- Escalation rate drivers (Summary tab)
- Abandon rate drivers (Summary tab)
- Resolution rate drivers (Summary tab)
Tip
Not seeing the Summary and Customer Satisfaction tabs? The new upgraded analytics experience replaces the existing set of tabs with a more actionable view of your agent's performance, user feedback, and knowledge source use.
To switch between the traditional and upgraded analytics experiences, use the New Analytics switch at the top of the page.
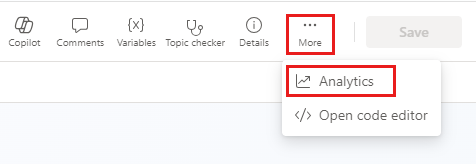
Alternatively, open the desired topic from the Topics page, and select More > Analytics.

The topic details page includes various charts with graphical views of a topic's key performance indicators. For information about each chart, see:
Topic summary charts
The Topic summary charts summarize the topic's performance indicators for the specified time period and the percent change over the period.
| Description | Details |
|---|---|
| Total sessions | The total number of sessions within the specified time period. |
| Average CSAT | The average customer satisfaction (CSAT) survey score for the specified time period. |
| Resolution rate | The percentage of engaged sessions that are resolved. |
| Escalation rate | The percentage of engaged sessions that are escalated. |
| Abandon rate | The percentage of engaged sessions that are abandoned. |
Impact summary charts
The Impact summary charts summarize the effects of the topic on key performance indicators for the specified time period.
| Description | Details |
|---|---|
| CSAT impact | The topic's customer satisfaction impact score. The customer satisfaction impact score is the overall average CSAT survey score including the topic minus the overall average CSAT survey score excluding the topic. |
| Resolution rate impact | The topic's resolution-rate impact score. The resolution-rate impact score is the overall resolution rate including the topic minus the resolution rate excluding the topic. |
| Escalation rate impact | The topic's escalation-rate impact score. The escalation-rate impact score is the overall escalation rate including the topic minus the escalation rate excluding the topic. |
| Abandon rate impact | The topic's abandon-rate impact score. The abandon-rate impact score is the overall abandon rate including the topic minus the abandon rate excluding the topic. |
Topic Volume by Day chart
The Topic volume by day chart provides a graphical view of the number of sessions for the topic over the specified time period.