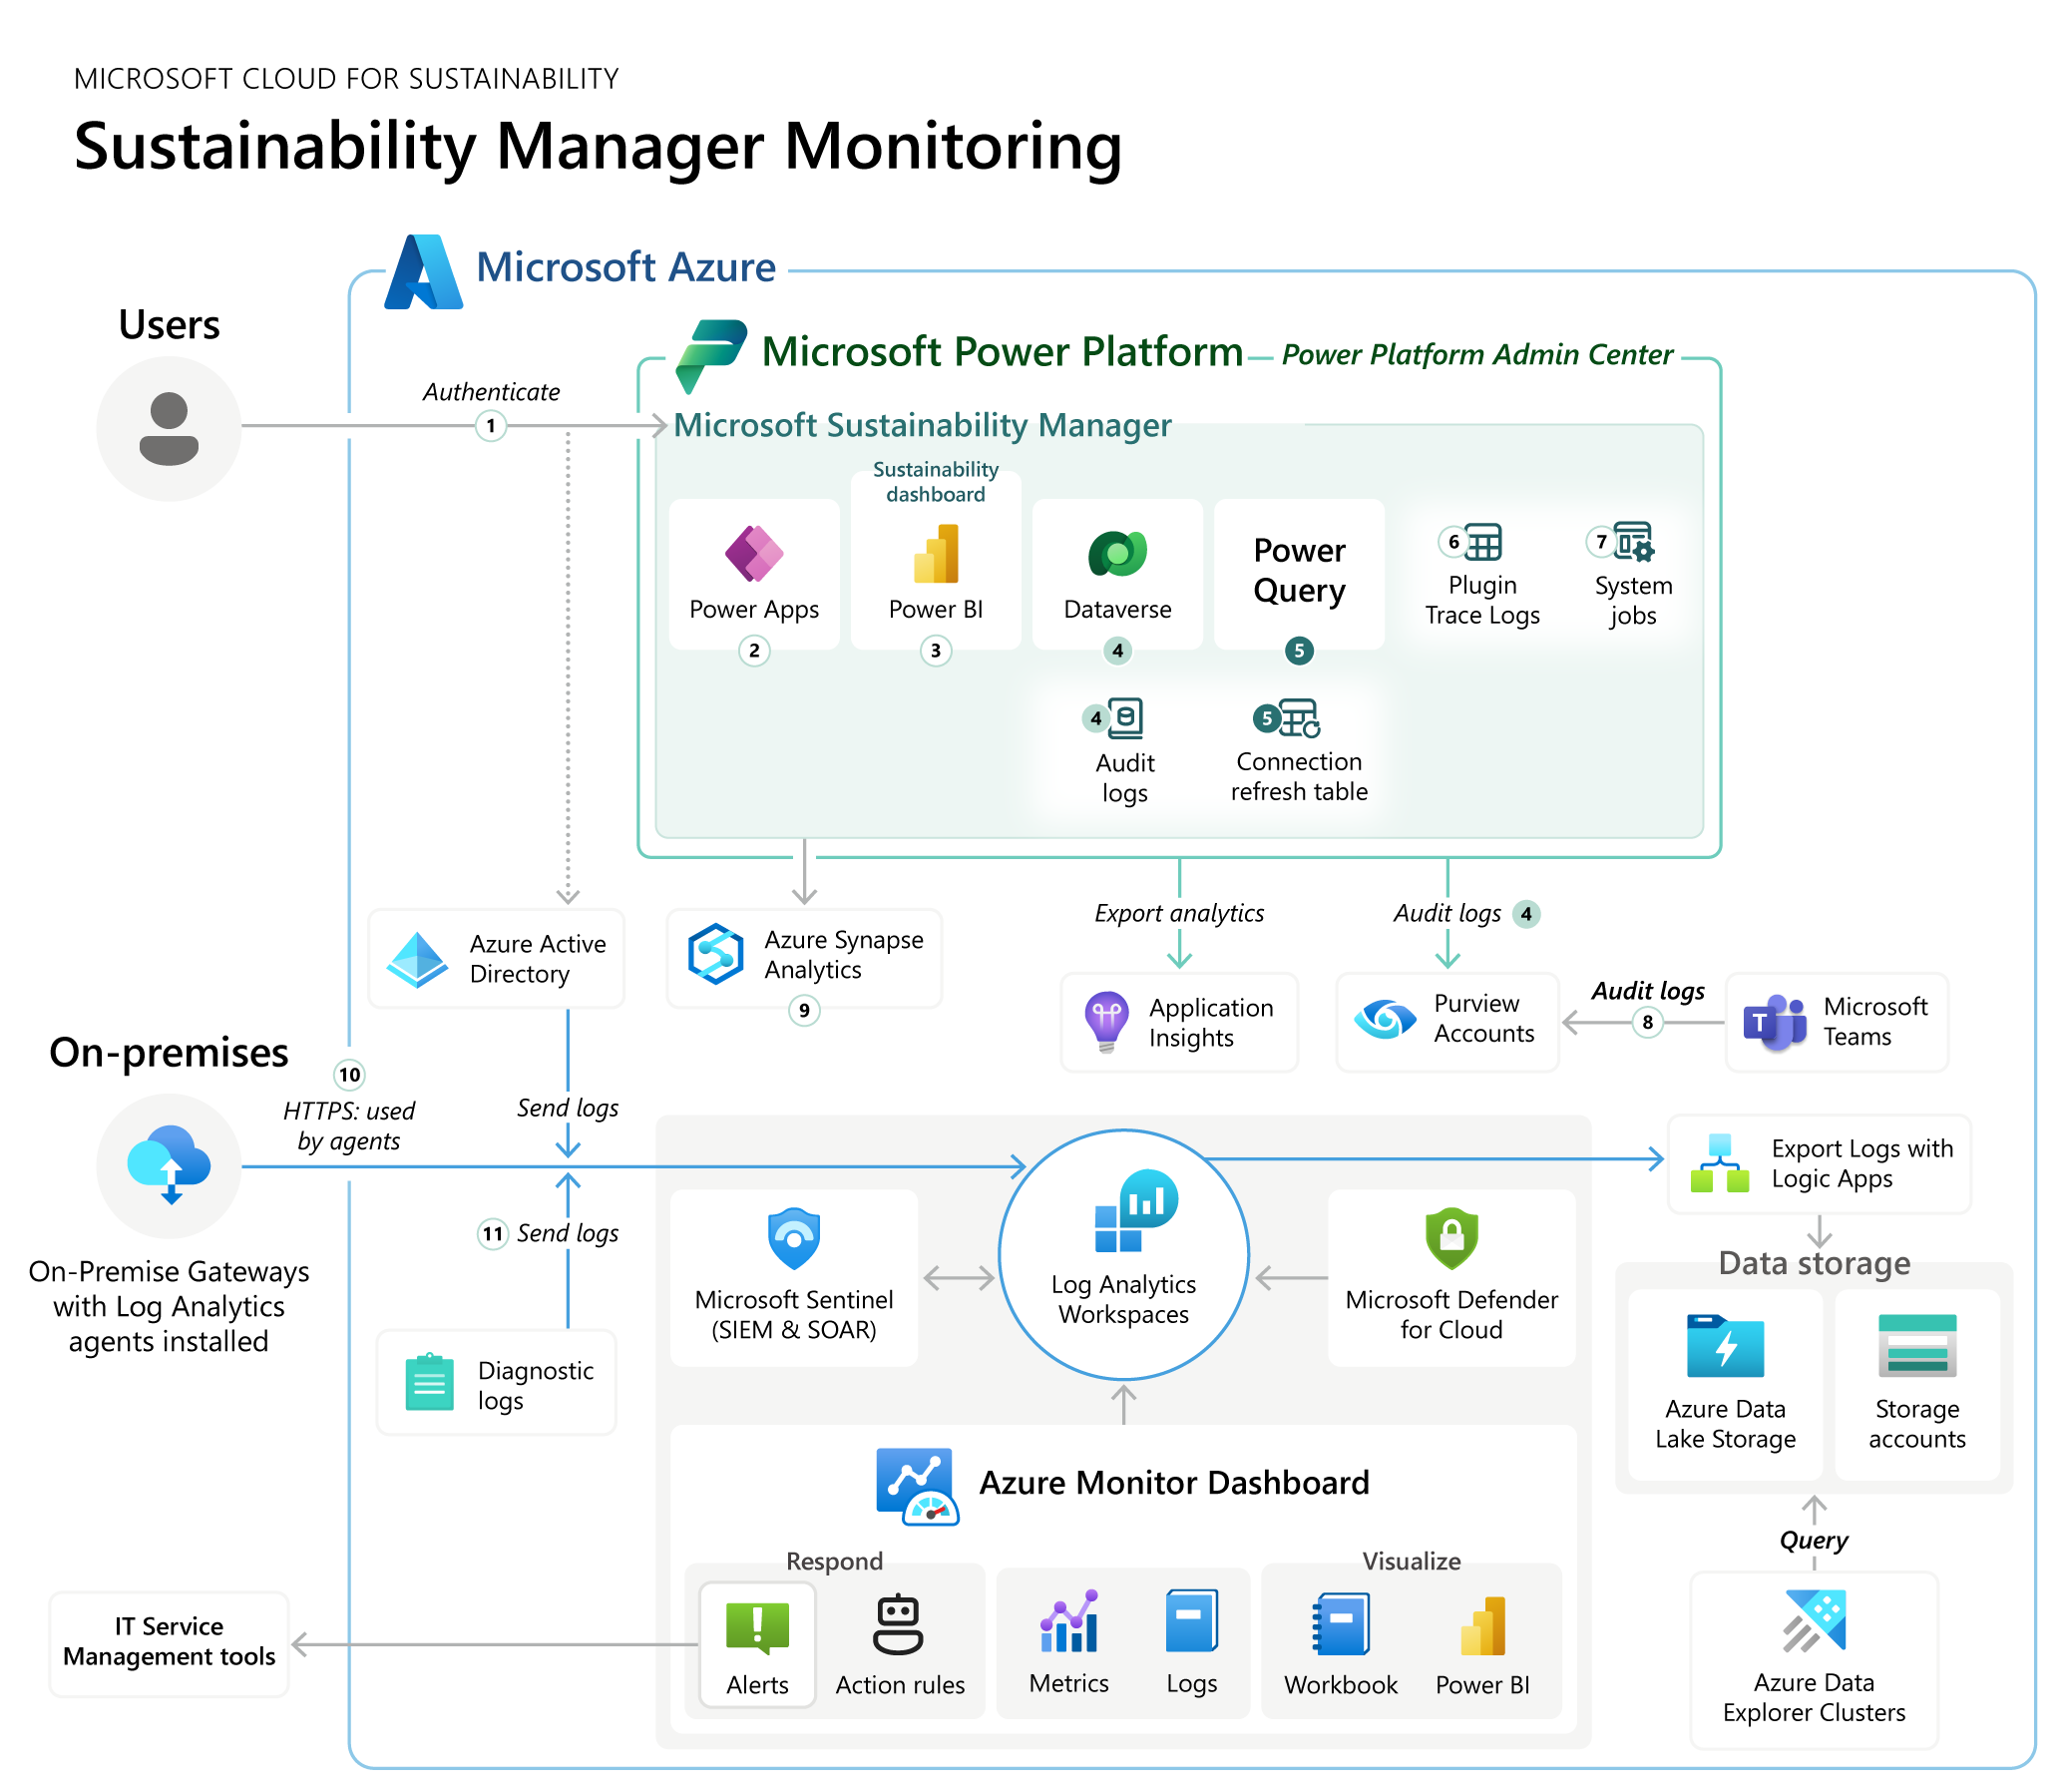
Centralized monitoring for Microsoft Sustainability Manager
Microsoft Sustainability Manager comprises components that run in three clouds (Azure, Microsoft 365, and Power Platform). The solution also relies on internal and external accessible emission data sources for calculations. Customers might also have customizations or ISV solutions in place.
With all these components in the architecture, it's important to track how customers use your system and monitor the health and performance of your system. Use the following checklist as a diagnostic aid to detect, correct, and prevent issues.
It's important to centralize monitoring to help you maximize the performance and availability of your resources and proactively identify problems. The following reference operational monitoring architecture is tailored for Sustainability Manager's needs. It uses a seamlessly integrated centralized monitoring capability that uses the following apps:
- Power Platform admin center
- Azure Monitor
- Microsoft Defender for Cloud
- Microsoft Purview
- Microsoft Sentinel
Download a printable PDF of the diagram.
To centralize logging and monitoring, you can send logs generated by Azure resources for identity, connectivity, and preprocessing, plus logs generated by other cloud resources, with on-premises data gateways to an Azure Log Analytics workspace. Use Azure Monitor to centralize these aggregated logs, monitor, visualize through Power BI and workbooks, and respond via alerts or defined action groups and rules. You can export aggregated logs to other storage options for later analysis via Azure Data Explorer.
The following table presents how each solution component in the diagram generates its operational and audit logs, how to monitor them, and how to define an alert mechanism.
| Number | Solution component | Monitoring | Logging | Auditing | Alerts |
|---|---|---|---|---|---|
| 1 | Authentication to Sustainability Manager | Microsoft Entra ID sign-in logs or activity logs sent to Azure Monitor | Sign-in, provisioning, and audit logs in Microsoft Entra ID | Changes to applications, groups, users, and licenses in Microsoft Entra audit logs | Custom Azure Monitor alerts SIEM: Microsoft Sentinel Cybersecurity: Microsoft Defender |
| 2 | Sustainability Manager model-driven app | Dataverse analytics | Telemetry events for model-driven apps | Audit: Audit summary view, Model-driven apps activity logging: Microsoft Purview | Custom Azure Monitor alerts |
| 3 | Sustainability Manager Power BI embedded dashboards | Microsoft managed | Microsoft managed | Microsoft managed | Microsoft managed |
| 4 | Dataverse | Dataverse analytics, Telemetry events for Dataverse | Request: Incoming API calls Dependency: Outgoing calls |
Dataverse auditing | Custom Azure Monitor alerts, System administrator alerts, Microsoft 365 Message center notifications |
| 5 | Sustainability Manager data error handling | Error handling for data import in Sustainability Manager | Connection refresh table (msdyn_dataconnectionrefresh) | Power Platform connector activity logs (preview) in Purview | You can develop a custom Power Automate to send a notification when Connection refresh table record fails |
| 6 | Sustainability Manager plugins (such as emissions calculation) | Dataverse Analytics | Plugin Tracelog, dependency, and exceptions table in Application Insights | Dataverse auditing | Custom Azure Monitor alerts |
| 7 | Sustainability Manager workflows | System jobs | System Job Table (AsyncOperation) | Dataverse auditing | A custom Power Automate to monitor system jobs failed records |
| 8 | Sustainability Manager Teams collaboration | Microsoft managed | Microsoft managed | Microsoft Purview | Microsoft 365 Message center notifications |
| 9 | Azure Synapse Link | Azure Synapse Link | Microsoft managed | Microsoft managed | Microsoft managed |
| 10 | On-premises data gateway | Gateway service health: On-premises data gateway management Gateway node monitoring: Azure Monitor and Log Analytics Gateway node performance: Windows Performance Monitor or Gateway performance PBI template |
Collect VM logs Slow-performing queries |
Log Analytics agent | Custom Azure Monitor alert |
| 11 | Azure connectivity and preprocessing resources | Azure Monitor | Log Analytics workspace | Azure resource diagnostics log | Custom Azure Monitor alert |
