Note
Access to this page requires authorization. You can try signing in or changing directories.
Access to this page requires authorization. You can try changing directories.
Important
Some or all of this functionality is available as part of a preview release. The content and the functionality are subject to change.
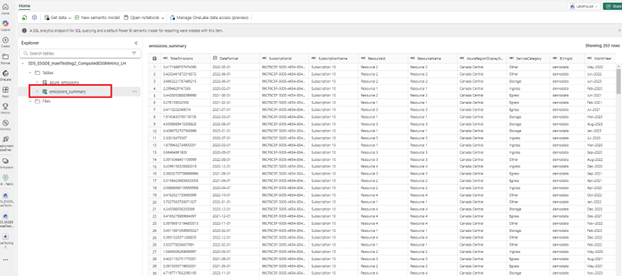
After your data is loaded into the IngestedRawData lakehouse, run the GenerateAggregateTables notebook to modify the tables that are compatible with the report. This notebook also performs a few data aggregations to provide more insights into the emissions data.
The aggregated data is available in the ComputedESGMetrics lakehouse under the Tables section as the emissions_summary table.
Here are some key points about this data:
This aggregated data is summarized on the following dimensions:
- Date
- Subscription
- Resource
- Region
- Service category
- Billing ID
Emissions data related to multiple billing IDs is available in this lakehouse.
The Total emissions value in this table is a sum of the scope 1, scope 2, and scope 3 emissions.
You can export this data, and you can access it through the SQL end point and OneLake APIs. For more details, go to Analyze emissions data.
You can combine, or join, the aggregated data with organization-specific data to derive more insights.
The prebuilt dashboard is built using this data in this table.

