Use care management analytics (preview) in healthcare data solutions
[This article is prerelease documentation and is subject to change.]
Care management analytics (preview) enables healthcare organizations to build analytical scenarios that improve patient outcomes and support data-driven decision-making. To learn more about the capability and understand how to deploy and configure it, see:
- Overview of care management analytics (preview)
- Deploy and configure care management analytics (preview)
Run the data transformation pipeline
The data pipelines associated with this capability transform raw data in the bronze lakehouse into aggregated data in the gold lakehouse. The foundational data transformation pipeline first converts the raw clinical data ingested in the bronze lakehouse into a tabular structure in the silver lakehouse. The care management analytics notebook then further aggregates this data, condensing vast amounts of granular information into concise insights that facilitate analysis and support decision-making.
To run this transformation end-to-end, follow these steps:
In your healthcare data solutions environment, open the healthcare#_msft_cma data pipeline.
Select the Run button.
After successful execution, the data is ready for use in analytics workloads.
View the charts on Power BI dashboards
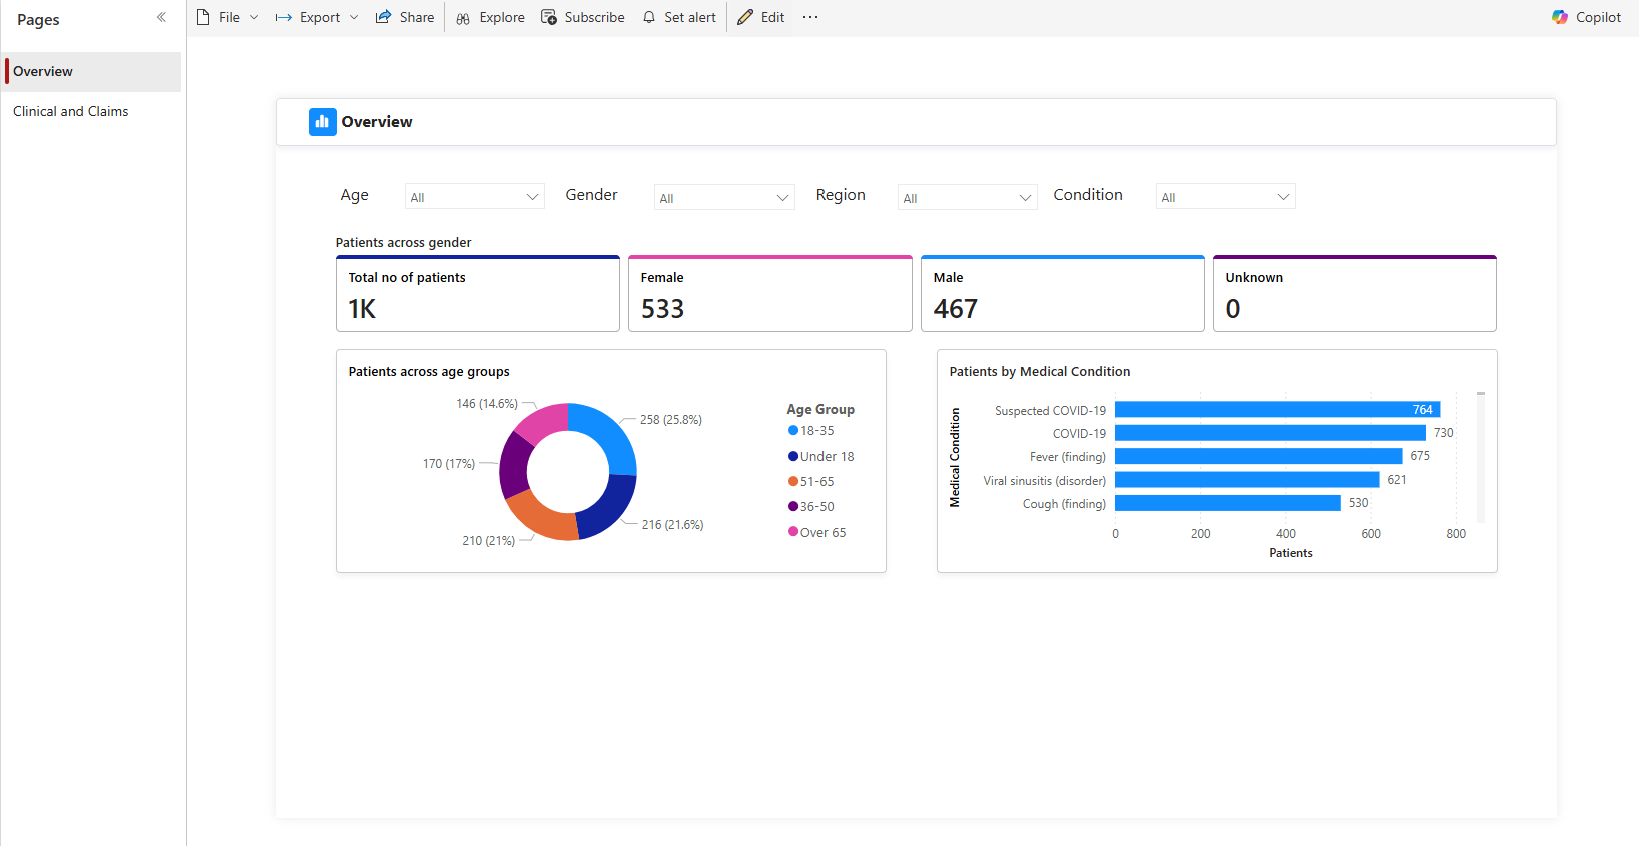
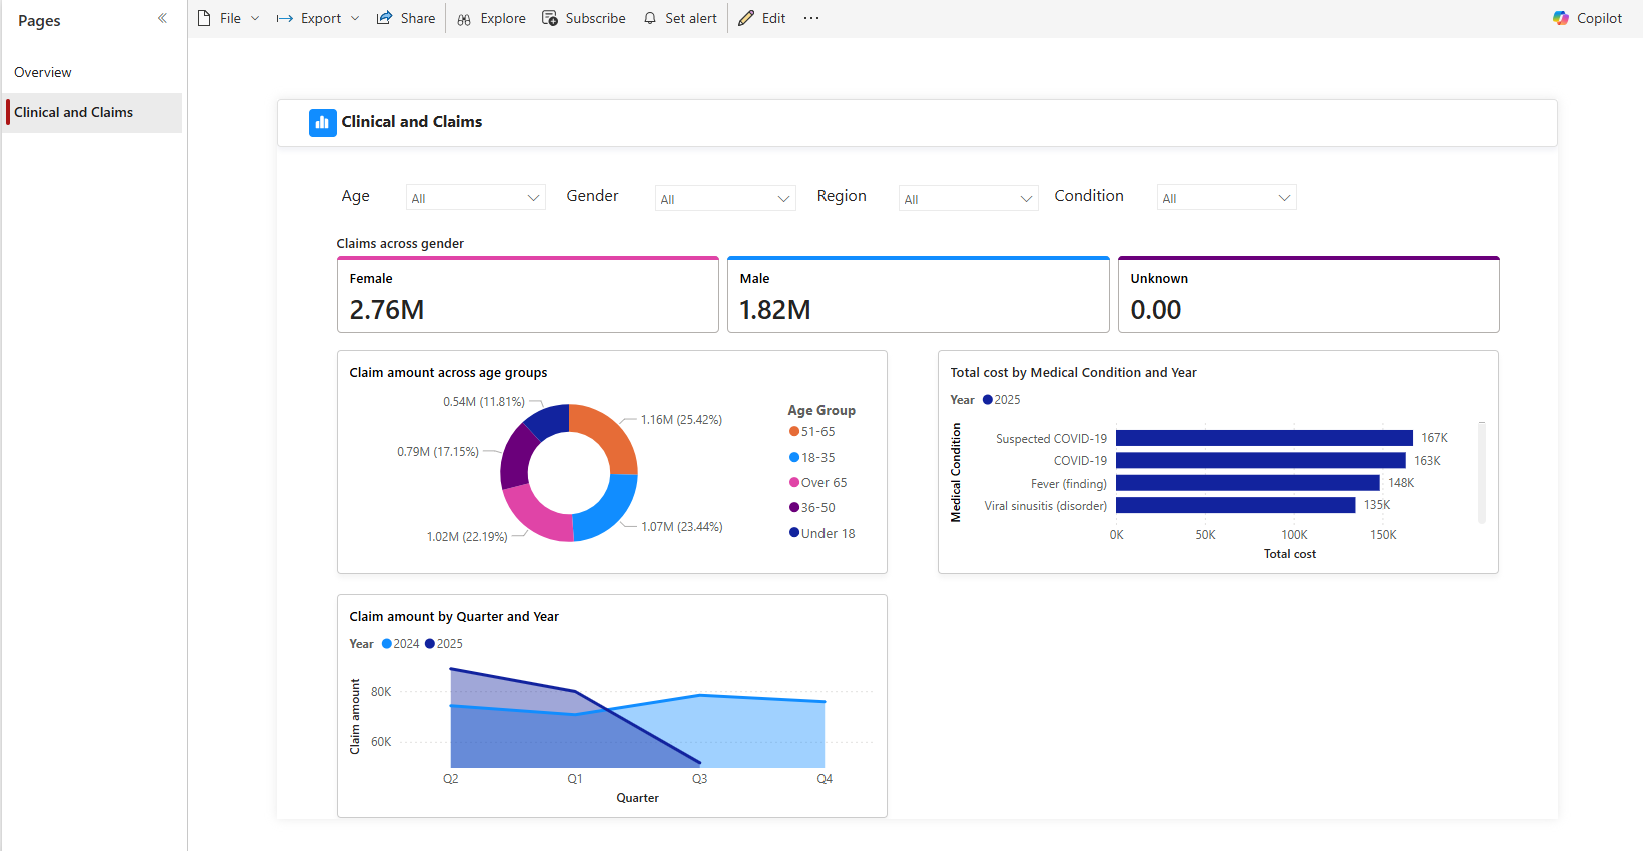
In your healthcare data solutions environment, open healthcare#_msft_cma_report to view the Power BI template dashboard for care management analytics (preview). The dashboard displays the following two pages: Overview and Clinical and Claims.
Overview
At the top of the dashboard, the key patient performance indicators provide a quick snapshot of overall patient metrics. The charts that follow provide a deeper dive into patient data, segmented by age groups and medical conditions. To refine the analysis, use the chart filters to drill down into specific datasets as needed. The data powering these insights is sourced directly from the clinical sample data.
Clinical and Claims
The visualizations on this page generate from both the clinical and claims sample data sources. You can explore various use cases, such as:
- Analyzing claims across different age groups
- Identifying medical conditions with the highest claims
- Observing claim trends over the years
These insights help you understand patient demographics, predict healthcare needs, and optimize resource allocation.
Usage considerations
Review these key points before using the care management analytics (preview) capability.
Spark version
The care management analytics (preview) notebooks are preconfigured to run with Spark runtime version 1.2 (Spark 3.4, Delta 2.4) by default. Ensure you maintain this setting at the environment level. To learn more, see Reset Spark runtime version in the Fabric workspace.
Power BI data model editing
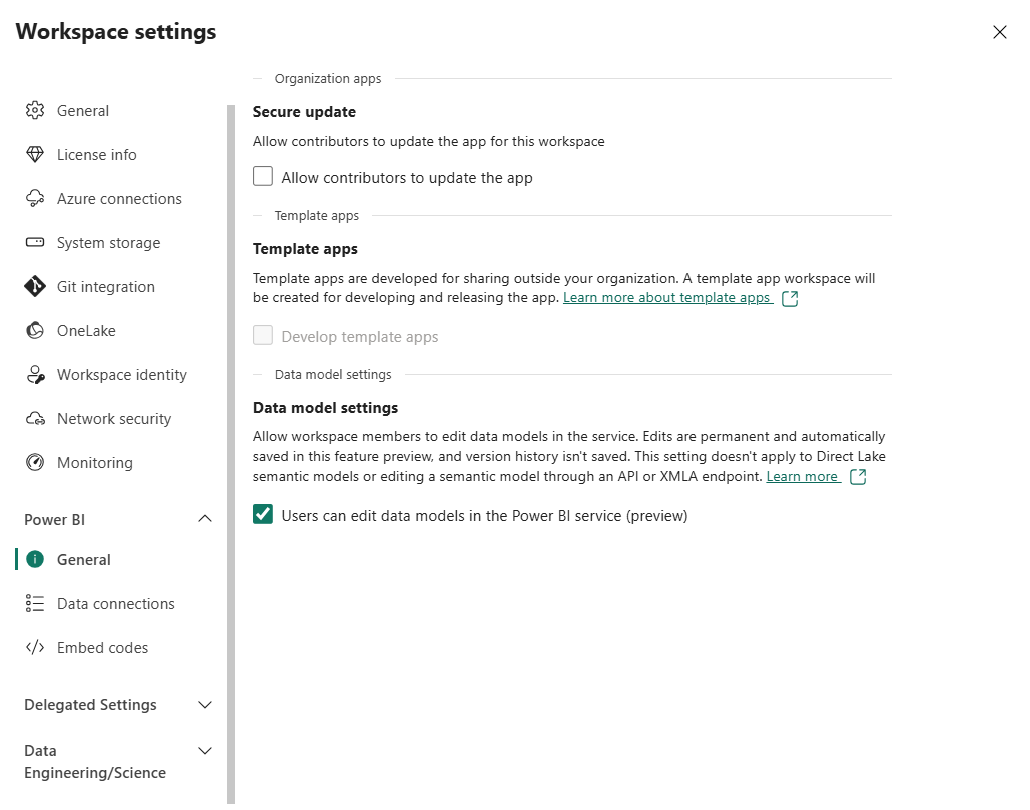
To allow users to edit the data model in Power BI:
Go to your healthcare data solutions workspace view and select Workspace settings.
On the workspace settings pane, expand the Power BI drop-down box, and select General.
Under Data model settings, select the checkbox Users can edit data models in the Power BI service (preview).
Column calculation
If you experience issues with calculated columns, reenter them to refresh with the latest data:
In your healthcare data solutions workspace view, select the ellipsis (...) beside the healthcare#_msft_cma_semantic_model semantic model.
Select Open data model.
In Model View, check the calculated columns. If any warning icons appear next to them, select the formula, cut it, and paste the DAX (Data Analysis Expressions) formula again to update it with the latest data.
Pipeline failure
When you process the clinical sample data for the first time, the care management analytics (preview) pipeline fails. This initial failure occurs because the clinical sample data contains erroneous records designed to test validation scenarios.
Rerun the pipeline for successful execution.


