Serialization
Use this topic to understand what thread serialization is and identify where portions of your code aren't running in parallel. Thread serialization occurs when work happening on different threads needs to execute in a specific order. This often happens when work on a particular thread requires work from another thread to complete first.
From a performance perspective, thread serialization is a form of threads locking . This pattern commonly occurs when a single-threaded algorithm has been converted into a multithreaded one but each portion of the multithreaded algorithm waits on a previous portion to finish before starting. A similar effect happens if there's a high dependency between jobs in a job system. This can cause the following issues to occur.
If the work isn't running in parallel, and if it's being performed only on one thread at a time, the algorithm is effectively still single-threaded, and it won't run any faster.
Added overhead from switching between threads.
Use the same steps found in Threads locking to troubleshoot the issue, focusing on the locations where the stair-step effect occurs between threads, or between CPU cores.
PIX
Figure 1 shows what the stair-step effect looks like in a PIX timeline.
Figure 1. Stair-step pattern in thread timelines in a PIX Timing Capture
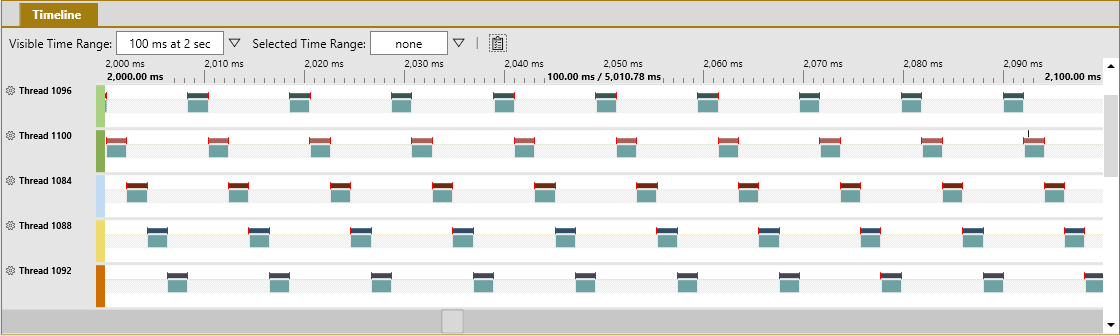
If your title has code that spins waiting for work, or if it attempts to acquire a lock on a portion of code needed for work, it can be useful to add PIX events around the spin and acquire portions. Adding these events can help you quickly identify thread behavior and searching for these events in PIX can help you identify when too much time is spent waiting. For more information about the spinning case, see Core utilization: spinning.
Note
With a context switch selected, you can use the Element Details window (shown in Threads locking) to help identify the exact line of code that's causing thread serialization to occur.
Windows Performance Analyzer (WPA)
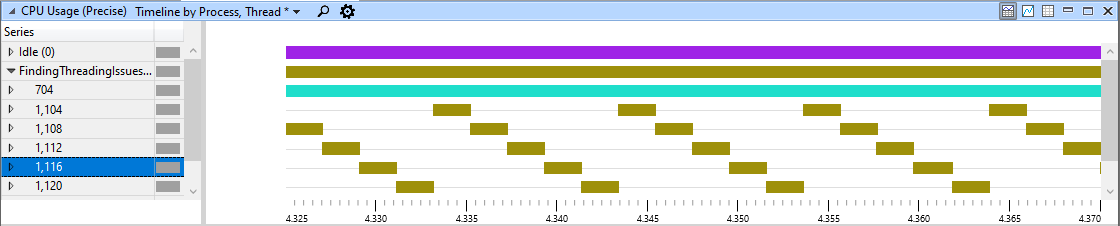
Figure 2 shows what it looks like when threads don't run in parallel.
Figure 2. Timeline by Process, Thread window that shows a stair-step effect where threads aren't running in parallel
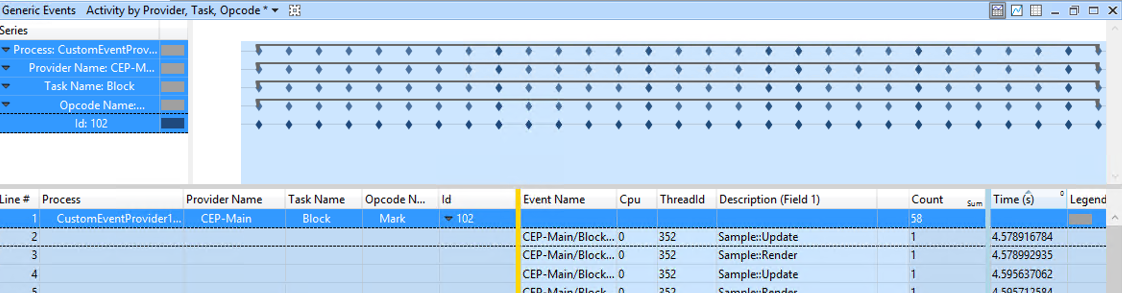
If your title has worker threads that spin while they're looking for work, you'll find it useful to add an Event Tracing for Windows (ETW) event. For an example, see figure 3. For details about adding ETWs, see the CustomEventProvider Sample. To download (Microsoft Game Development Kit (GDK) samples, see Xbox Developer Downloads). You should add events around the spinning block and processing blocks on the worker thread. The Generic Events Activity by Provider, Task, Opcode window in WPA shows when each event fires. To identify threads that are spinning excessively, see Core utilization: spinning.
Figure 3. Generic Events window that shows custom ETW events from the CustomEventProvider sample