Core utilization: spinning
Use this topic to find areas where the core is spinning and not doing useful work. Spinning for a very short time is beneficial in certain circumstances, such as waiting on data that's available very shortly. However, spinning for an extended period is wasteful when there's useful work to perform.
Performance Investigator for Xbox (PIX)
It's useful to create a Performance Investigator for Xbox (PIX) event around all sections of code that could spin. You can do this by using PixBeginEvent and PixEndEvent in your code around the spin block.
Use the following steps to investigate spinning threads in PIX.
Start with the information that's in the Common steps topic, and create a Timing Capture.
Focus on the Range Details and ensure that Items to Show is set to PIX Events (CPU).
Use the search box at the top of Range Details to filter to just the spin event. In this case, it's labeled
Spinas shown in figure 1.Figure 1. Shows the list of events that appear after adding a PIX marker when the title spins
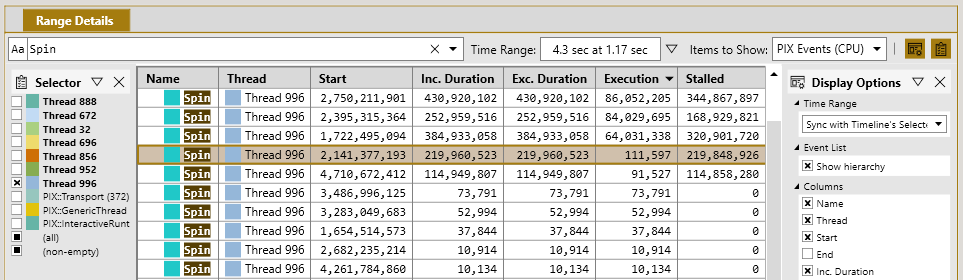
Review the Duration and Execution columns for each instance. Selecting the title of a column sorts the events by that value.
In figure 1, the highlighted event has a duration of 219 ms and an execution of 111 microseconds (μs).
- Duration is the total time the event was active, including time that the thread was stalled.
- Execution is the total time that the event was active, and that the thread was executing on a core.
- Stalled is another way to see how much of the event duration that the thread spent not executing.
- An even worse case is the
Spinevent that's shown at the top of figure 1. The event executed for 86 ms in addition to a 344 ms stall. The CPU core executed in the spin loop for an entire 86 ms. This was wasted time that could have been spent performing other tasks.
Windows Performance Analyzer (WPA)
To determine areas where a title may be spinning in Windows Performance Analyzer (WPA), all locations where the code might spin should be placed in a non-inline function for profiling builds. This makes it very easy to determine if too much time is spent spinning. Because the title is spinning and not performing a context switch, sampled data must be used. If the title is spinning by rapidly switching between threads by using SwitchToThread, follow the steps that are provided in the topic High context switch rate.
Start with the information that's in the Common steps topic to create an Event Tracing Log (ETL) file.
Use the ThreadSpinning.wpaProfile WPA profile as described in the topic Common steps. Figure 2 shows what the new analysis tab looks like.
Figure 2. Shows the default view of the
ThreadSpinningWPA profile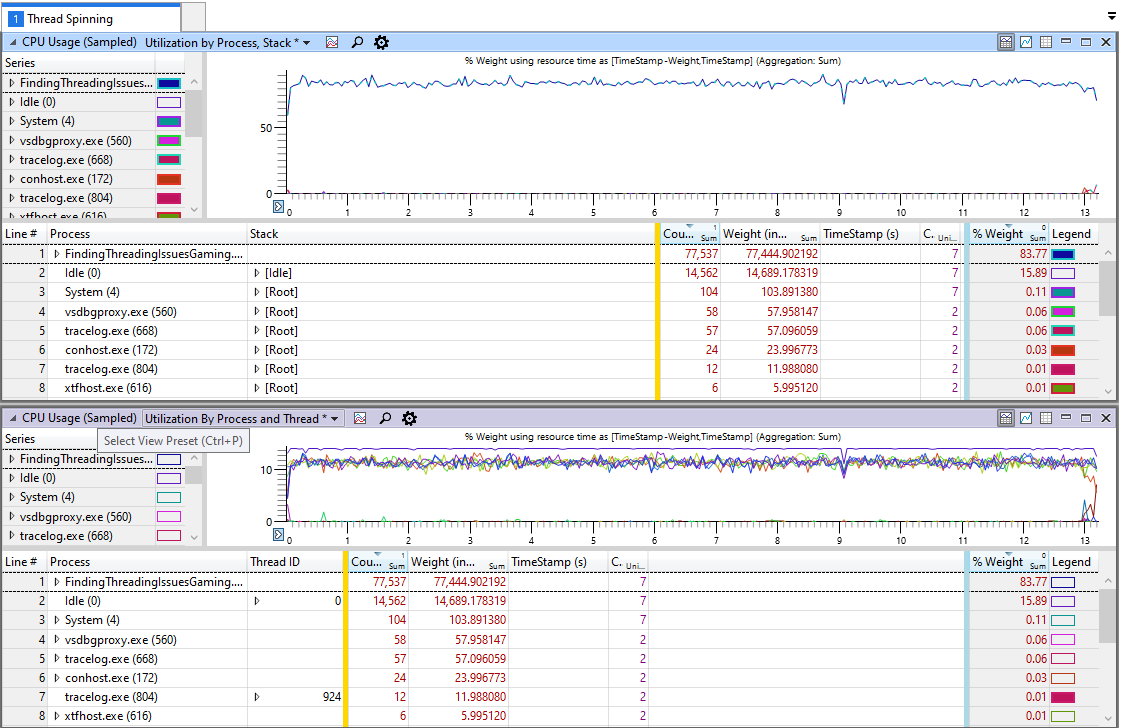
The % Weight column shows the percentage of samples for each line of the data table. This is highly correlated to the total amount of time that's spent in the function as shown in figure 3.
Figure 3. Shows the CPU Usage (Sampled) Utilization by Process, Stack window, where the
FindingThreadingIssuesprocess has 83 percent of the sampled data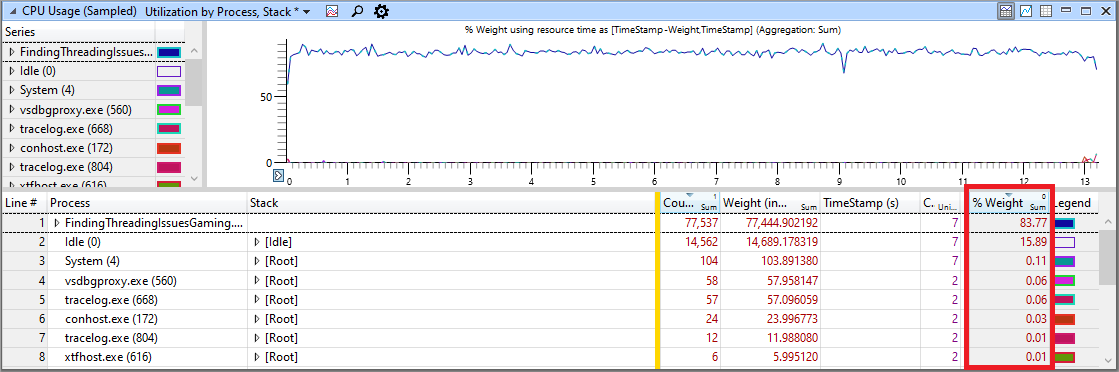
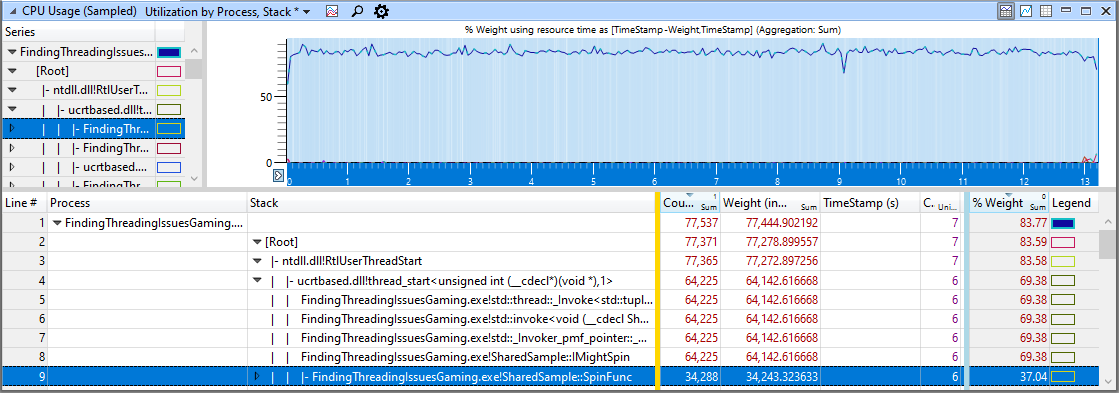
Use the Find in Column... command in the context menu of the data table's Stack column to find any functions that are known to spin by right-clicking on the column. Review the % Weight column to determine if too much time is spent spinning as shown in figure 4.
Figure 4. Shows walking down the call stacks for the spinning function
SpinFuncthat's responsible for 37 percent of the samples