Walkthrough: Configure Best Practices Analyzer in Unified Service Desk
This walkthrough demonstrates how you can configure and set up Best Practices Analyzer in your agent application.
Step 1: Create a Best Practices Analyzer and toolbar container hosted control
In this step, you'll create a Best Practices Analyzer and toolbar container hosted control.
Sign in to the Dynamics 365 instance.
Select the down arrow next to Dynamics 365.
Select Unified Service Desk Administrator.
Select Hosted Controls under Basic Settings.
Select New in the Active Hosted Controls page.
Specify the following values on the New Hosted Control page:
Tab Field Value General Name Best Practices Analyzer General Display Name Best Practices Analyzer General USD Component Type USD Hosted Control General Application is Global Checked General Display Group MainPanel General Application is Dynamic Checked General User Can Close Checked Hosting Assembly URI Microsoft.Crm.UnifiedServiceDesk.BestPracticesAnalyserHosting Assembly Type Microsoft.Crm.UnifiedServiceDesk.BestPracticesAnalyser.BestPracticesAnalyserControl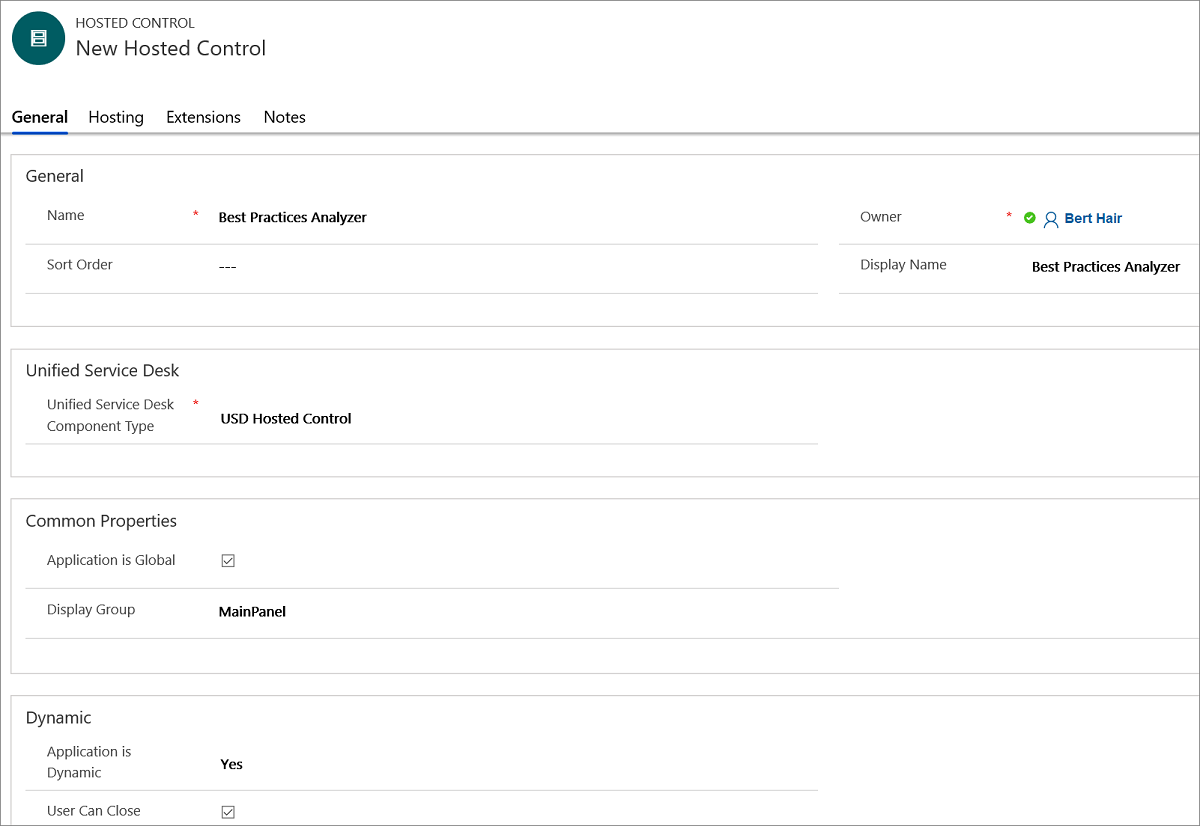
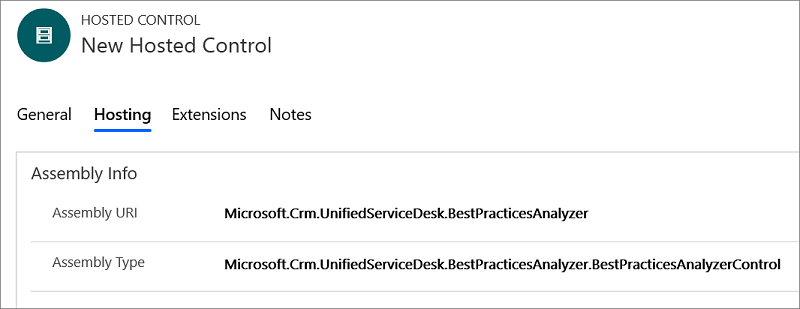
Select Save.
Select + New.
Specify the following values on the New Hosted Control page:
Field Value Name About Toolbar Container USD Component Type Toolbar Container Display Group AboutPanel 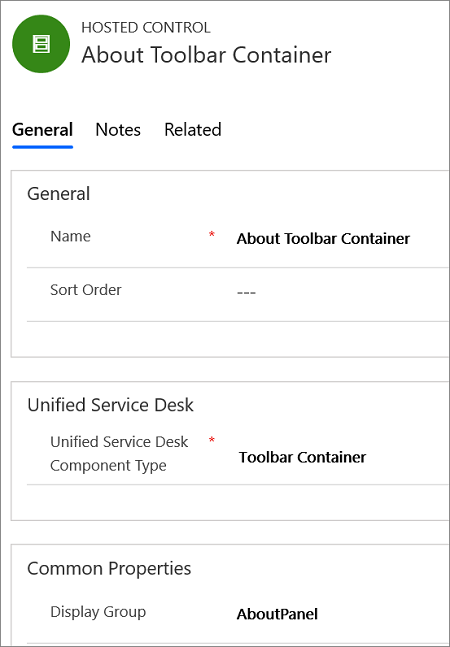
Select Save.
Step 2: Add a toolbar and attach it to the toolbar container
In this step, you’ll create a toolbar, and attach the toolbar to the toolbar container hosted control created in step 1.
Sign in to the Dynamics 365 instance.
Select the down arrow next to Dynamics 365.
Select Unified Service Desk Administrator.
Select Toolbars under Basic Settings.
Select New in the Active Toolbars page.
Type About Toolbar in the Name box, and then select Save.
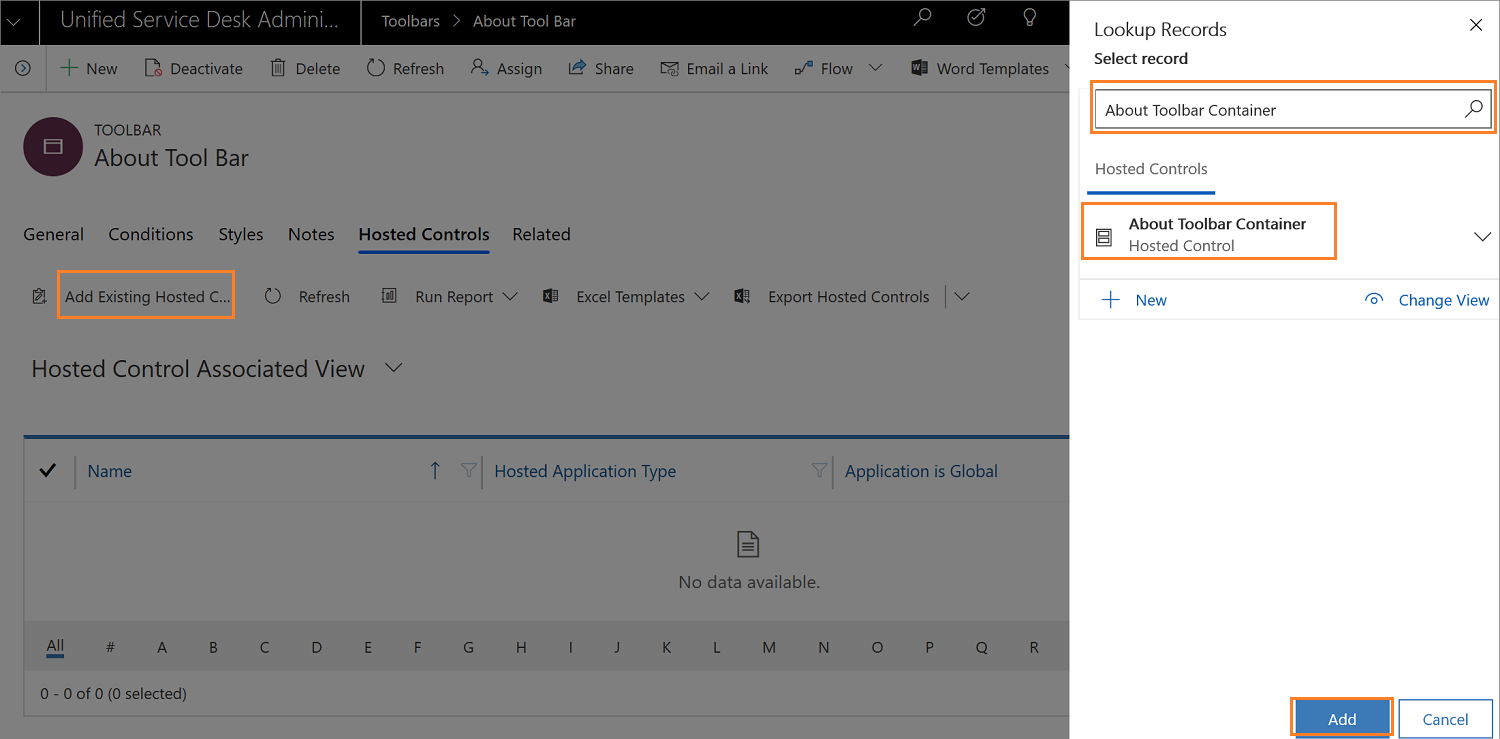
Attach the toolbar to the toolbar container hosted control created in step 1. Select the Related tab and select Hosted Controls. The Hosted Controls tab appears.
Select Add Existing Hosted Control. The Lookup Records pane appears.
Type About Toolbar Container in the search box, and select the search icon. The record appears, choose the hosted control and select Add.
Select Save.
Step 3: Add toolbar button
In this step, you’ll create two buttons - Settings and Best Practices Analyzer, and Best Practices Analyzer button under Settings button.
After you save the toolbar in step 2, select the Related tab and select Buttons. The Buttons tab appears.
Select + Add New Toolbar Button. A new toolbar button page appears.
Specify the following values on the New Toolbar Button page:
Field Value Name Settings Image msdyusd_settings_16 Tooltip Settings Order 100 
Select Save.
After you save the Settings toolbar button, select + New to create another button called Best Practices Analyzer.
Specify the following values on the New Toolbar Button page:
Field Value Name Best Practices Analyzer Button Text [[$Resources.BestPracticesAnalyzer]] Tooltip Best Practices Analyzer Order 4 
Attach the Best Practices Analyzer button under Settings button. Select the Settings button, select the Related tab, and then select Toolbar Buttons. The Toolbar Buttons tab appears.
Select Add Existing Toolbar Button. The Lookup Records pane appears.
Type Best Practices Analyzer in the search box, and select the search icon. The record appears. Select the record and then select Add.
Select Save.
Step 4: Add action calls to display the Best Practices Analyzer
In this step, you'll add actions calls the to Best Practices Analyzer toolbar button so that when you click on it, Best Practices Analyzer tab is displayed in the hosted control that you created in step 1.
Select Action Calls in the site map.
Select + New in the Active Action Calls page.
Specify the following values on the New Action Call page.
Field Value Name Action Call: Best Practices Analyzer Order 1 Hosted Control Best Practices Analyzer Action default 
Select Save.
Create another action call. Select + New.
Specify the following values on the New Action Call page.
Field Value Name Focus: Best Practices Analyzer Order 4 Hosted Control CRM Global Manager Action ShowTab Data Best Practices Analyzer 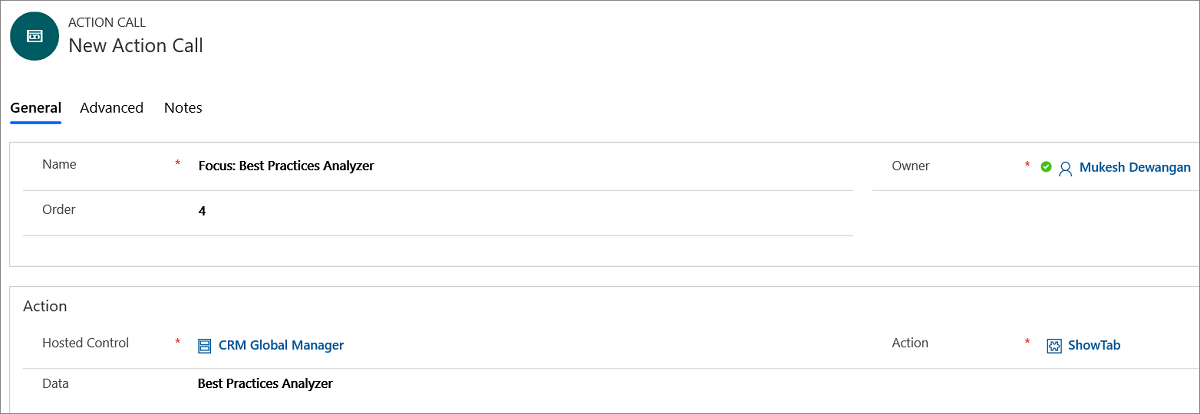
Select Save.
Select Toolbars in the site map.
Select About Tool Bar in the Active Action Calls page, and then select Settings under the buttons section.
Select Add Existing Action Call in the Actions section. The Lookup Records pane appears.
Type Action Call: Best Practices Analyzer in the search box and select the search icon. The record appears. Select the action call and select Add. The new action call is added to the button.
You’ll add another action call to the button to set the focus on the hosted control that show the Best Practices Analyzer in the client application. Select Add Existing Action Call in the Actions section. The Lookup Records pane appears.
Type the Focus: Best Practices Analyzer action call in the search box and select the search icon. The record appears. Select the action call and select Add. The new action call is added to the button.
Select Save.
Step 5: Add the controls to the configuration
In this step, you’ll add the action call, hosted control, toolbar, toolbar buttons, and action calls that were created in this walkthrough to Contoso Configuration to display these controls to the user who is assigned to the configuration. If you have not created Contoso Configuration. Visit, Walkthrough 1: Build a simple agent application.
Add the following to Contoso Configuration.
| Control name | Control type |
|---|---|
| Action Call: Best Practices Analyzer | Action Call |
| Focus: Best Practices Analyzer | Action Call |
| About Toolbar Container | Hosted Control |
| Best Practices Analyzer | Hosted Control |
| About Toolbar | Toolbar |
To add a control to the configuration:
Sign in to the Dynamics 365 instance.
Select the down arrow next to Dynamics 365.
Select Unified Service Desk Administrator.
Select Configuration under Advanced Settings.
Select Contoso Configuration to open the definition.
Select the Hosted Controls, Events and Action Calls tab.
Select the ellipsis ... (more commands option) in the Action Calls section.
Select Add Existing Action Call. The Lookup Records pane appears.
Type Action Call: Best Practices Analyzer in the search box, and then select the search icon. The action call listed earlier are displayed in the search results. Select the action and then select Add.
Follow the steps 7 to 9 to add the Focus: Best Practices Analyzer action call.
Select the ellipsis ... (more commands option) in the Hosted Controls section.
Select Add Existing Hosted Control. The Lookup Records pane appears.
Type Best Practices Analyzer in the search box, and then select the search icon. The hosted control listed earlier are displayed in the search results. Select the action and then select Add.
Follow the steps 11 to 13 to add the About Toolbar Container hosted control.
Select the Toolbars, Window Navigation Rules and Entity Searches tab.
Select the ellipsis ... (more commands option) in the Toolbars section.
Select Add Existing Toolbar. The Lookup Records pane appears.
Type About Toolbar in the search box, and then select the search icon. The hosted control listed earlier are displayed in the search results. Select the action and then select Add.
Select Save to save the changes.
Step 6: Test Best Practices Analyzer in your agent application
Best Practices Analyzer is a hosted control that helps you analyze the various parameters of your local computer (system configurations and Unified Service Desk), Unified Service Desk configurations in Dynamics 365, and Internet Explorer settings in your local computer. After the analysis, Best Practices Analyzer displays a report that recommends mitigation steps in case of a warning or error.
Unified Service Desk works best when you handle the warning and error as recommended—this helps you to serve your customers without interruption.
To analyze parameters on your computer, Unified Service Desk configurations, and internet settings, against the best practices rules:
Sign in to the Unified Service Desk client application.
Select the Settings list on the toolbar.
Select Best Practices Analyzer.
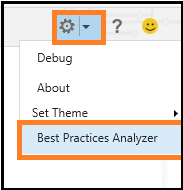
Select Start Analysis.
Best Practices Analyzer displays the report—it can help you determine your next steps.
Note
When you relaunch Unified Service Desk and select Best Practices Analyzer, the last report that was generated appears in the report area.
See also
Analyze best practices in Unified Service Desk
Download and install Best Practices Analyzer
Read Best Practices Analyzer report