Read Best Practices Analyzer report
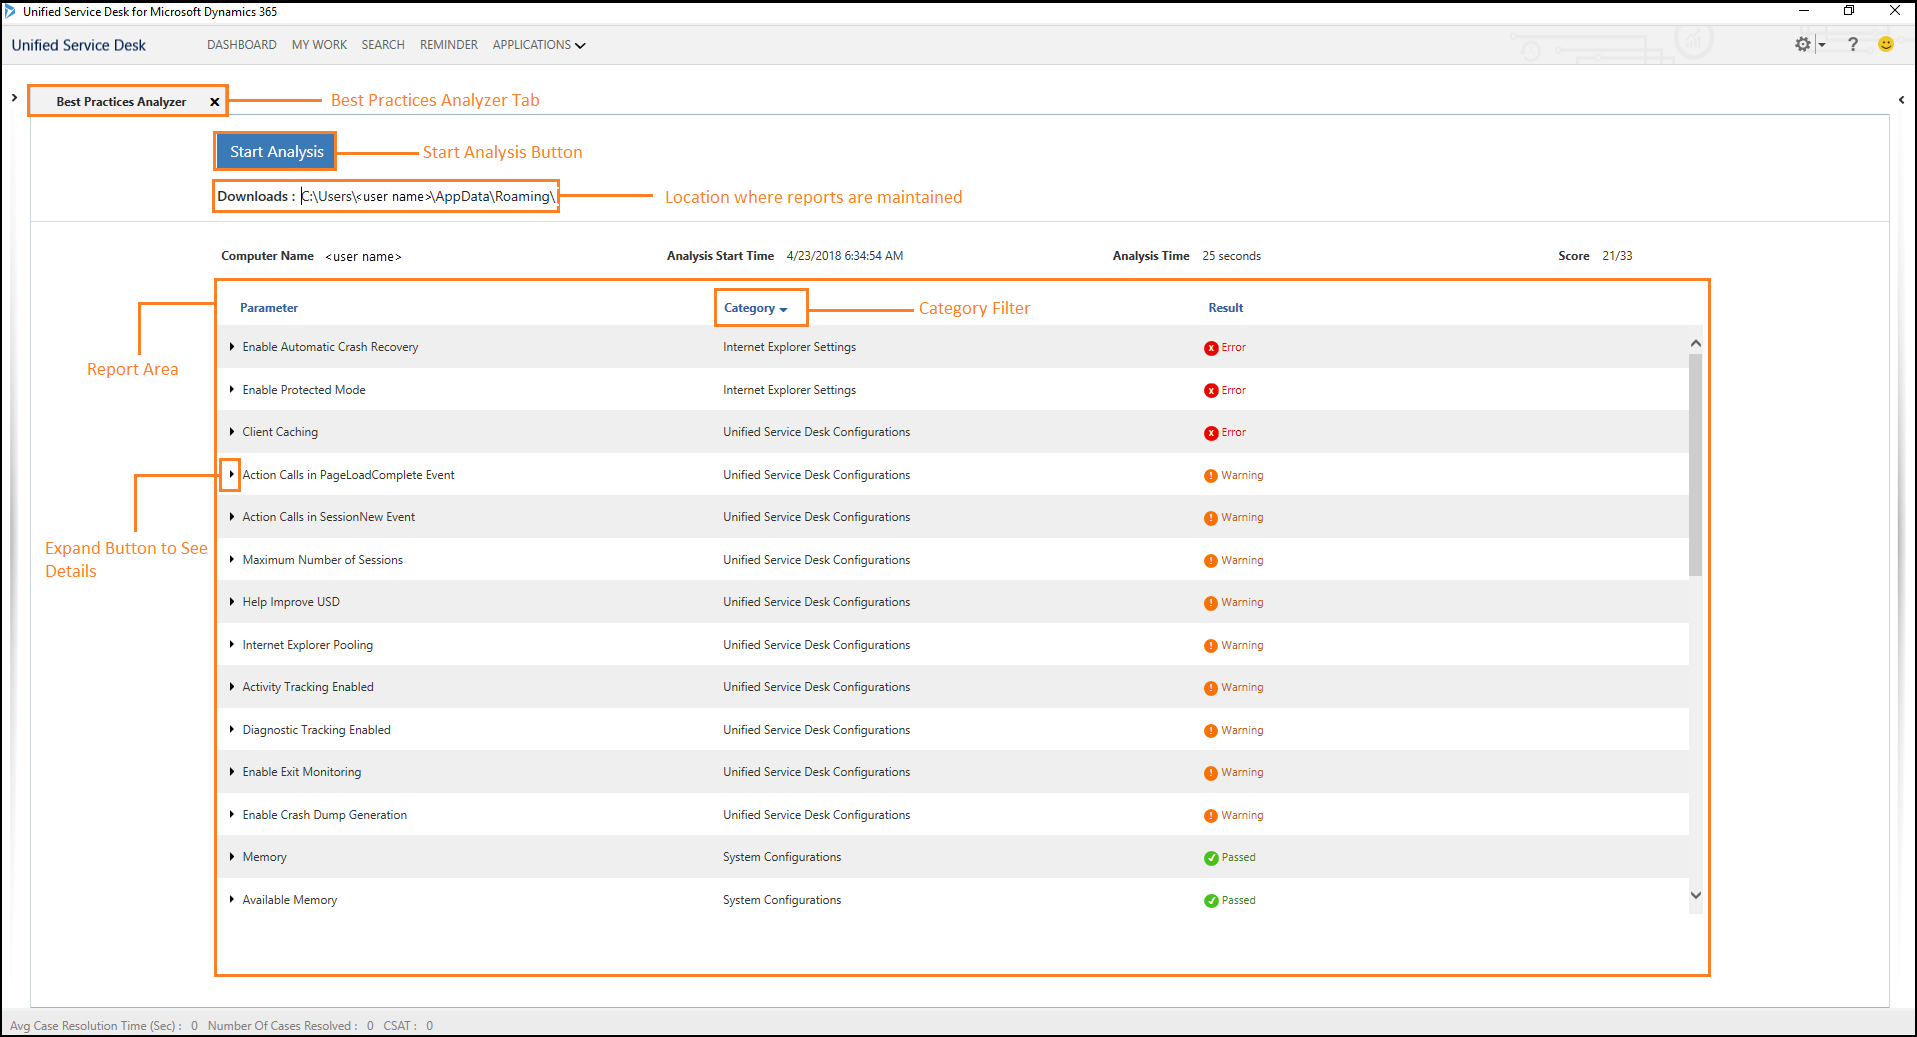
This section describes the layout of the Best Practices Analyzer report and provides information to help you understand the results of the analysis.

The report displays the following elements:
| Element | Description |
|---|---|
| Downloads | This is the location where the generated report is maintained.C:\Users\<User>\AppData\Roaming\Microsoft\Microsoft Dynamics 365 Unified Service Desk\<Version>\BPA\BPALogs\ |
| Computer name | Local computer name on which Best Practices Analyzer performed the analysis. |
| Analysis Start Time | The time at which the you start analysis. The format of the Analysis Start Time appears as a timestamp in the format <MM-DD-YYYY> <HH:MM:SS>. |
| Analysis Time | The time taken in seconds to complete the analysis. |
| Score | Number of parameters passed / Total number of parameters. |
| Parameter | The parameter name against which Best Practices Analyzer performs analysis. |
| Category | The category name under which the parameter is classified. Clicking on the Category list, you can filter the categories to see information under those categories.  |
| Result | The analysis result of the parameter. |
Expand parameter to see details
You must expand a parameter to see the details, which illustrate the following:
| Element | Description |
|---|---|
| Current Value | This is the value you configure. |
| Recommended Value | This is the value that Best Practices Analyzer recommends configuring. |
| Description | This is the description about the parameter. |
| Mitigation Steps | These are the steps that you must perform to mitigate the issue. Note: The mitigation steps appear when the report displays an error or warning. |
See also
Analyze best practices in Unified Service Desk
Download and install Best Practices Analyzer
Walkthrough: Configure Best Practices Analyzer