Patient population dashboard (preview)
Important
Patient population dashboard was previously available in preview mode to allow users to test its functionality. However, effective January 30, 2025, the solution will be retired and no longer supported.
Have questions? Reach out to us at Microsoft Cloud for Healthcare.
Patient population dashboard (preview) provides a summary of the key metrics of your patient population and helps you identify patient cohorts for outreach.
Note
This article describes the functionality of the dashboards before any configuration. However, if your administrator configured the dashboard, the functionality might differ from what's described here.
Appointments dashboard
The appointments dashboard provides a summary view of scheduled patient appointments. It also includes key statistics such as appointment attendance, scheduled appointments by provider service types, and time since patients' last appointment.
Slicers
Slicers help you quickly focus on data points of your interest. You can use the relative date slicer to filter the dashboard data by the appointment start date (msemr_starttime). You can also use the age range and gender slicers to filter the associated patient information. The age range and gender slicers support functions such as "Select all" and multiple selections.
| Slicer | Field |
|---|---|
| Date range | msemr_appointmentemr.msemr_starttime |
| Age range | current date - contact.birthdate |
| Gender | contact.gendercode |
Key metrics
The dashboard cards allow you to assess the total number of scheduled and missed appointments, including the rate of change over the previous same period.

Important
- Scheduled appointments are appointments with an appointment status of booked, arrived, checked-in, no show or fulfilled, and activity status not marked as cancelled.
- Missed appointments are appointments with an appointment status of no show, and activity status not marked as cancelled.
Charts
The appointments dashboard displays the following charts for analysis:
Appointment attendance: Provides a view of attended scheduled appointments versus missed scheduled appointments by percentage.

Important
Attended appointments are appointments with an appointment status of fulfilled, and activity status not marked as cancelled.
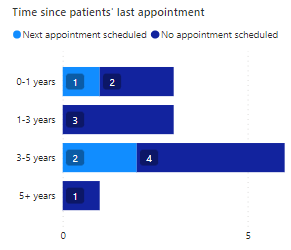
Time since patients' last appointment: Shows the number of patients grouped by their last "fulfilled scheduled appointment" visit, measured in terms of years.
Patients are categorized under Next appointment scheduled if they have a scheduled appointment in the future and No appointment scheduled if they don't have an appointment scheduled in the future.
Top 10 scheduled provider service types: The treemap chart reflects the top 10 service categories associated with the scheduled appointments.
- The visual also includes details regarding the appointment channel.
- The chart sorts the top 10 records by the count of appointments for each service category and the service category name.

Provider service types and attendance: Shows the appointment attendance per service category.


Hospitalizations dashboard
The hospitalizations dashboard provides a summary view of inpatient hospitalizations. It also includes key statistics such as total hospitalizations, total readmissions, average encounters in days, hospitalization types, encounter lengths, top 10 conditions for hospitalization, and follow-up appointment attendance.
Slicers
You can use the relative date slicer to filter the dashboard data by hospitalization start date, and the age range and gender slicers to filter the associated patient information.
| Slicer | Field |
|---|---|
| Date range | msemr_ve_encounter.msemr_encounterstartdate |
| Age range | current date - contact.birthdate |
| Gender | contact.gendercode |
Key metrics
The dashboard cards allow you to assess the following metrics, including the rate of change over the previous same period:
- Total hospitalizations
- Total readmissions
- Average encounter in days

Important
Hospitalizations are defined as encounters meeting both of the following conditions:
- Encounters that don't have canceled or entered in error statuses.
The encounters must have valid start and end dates, with the start date not exceeding the end date. - Encounters classified as inpatient encounter, inpatient acute, or inpatient non-acute, or having an inpatient class history.
- Encounters that don't have canceled or entered in error statuses.
Readmissions are hospitalizations where the readmission field is populated.
Average encounter is the duration (in days) between the hospitalization encounter start date and end date, including the start and end dates. If the class history has an inpatient value and not the encounter, then the start and end dates of the class history are used instead.
Charts
The hospitalizations dashboard displays the following charts for analysis:
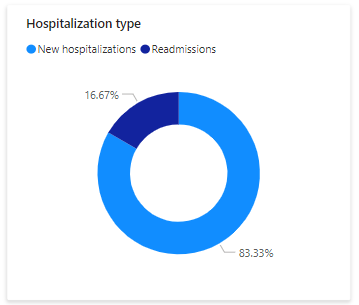
Hospitalization type: Provides a view of new hospitalizations versus readmissions by percentage.
Encounter lengths (includes hospitalizations): Shows the percentage of encounters that are longer or shorter than the average encounter length.

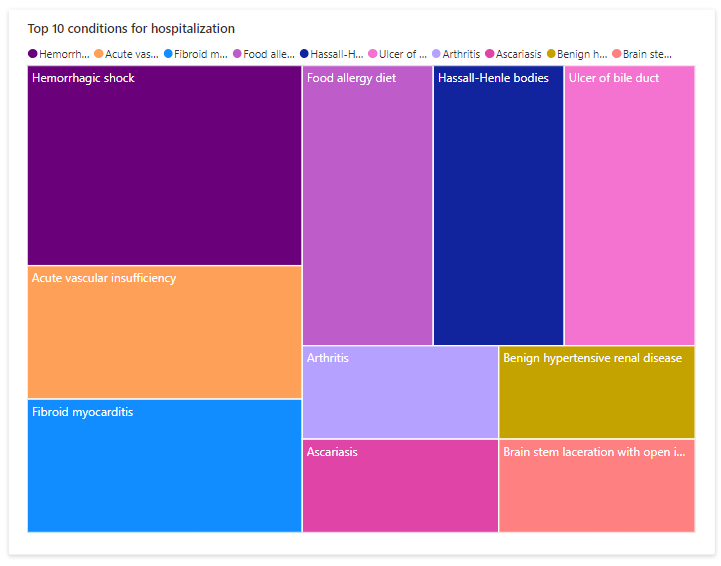
Top 10 conditions for hospitalization: The treemap chart reflects the top 10 conditions associated with the hospitalizations.
The chart sorts the top 10 records by the total count of conditions and the condition name.
Follow-ups set by provider after hospital discharge: Shows the follow-up appointment attendance and whether the visit is within or beyond seven days after hospital discharge.
Follow-up appointments must be scheduled appointments labeled as Follow up. If there's no follow-up, the hospitalization is categorized as No provider follow-up.


Troubleshoot
This section shows you how to troubleshoot some of the problems you might encounter with patient population dashboard (preview).
Missing permissions
After selecting Go to setup from Solution Center, the following message is displayed - "Contact your admin about permissions for installing this app".

Ensure that you follow the prerequisite step to enable apps not listed in AppSource.
Issues with data refresh or app updates
Use the following steps to ensure that the configuration is correct and refresh the dataset:
- Go to the workspace panel and open the app workspace.
- Open the Parameters section in the dataset settings and make sure the Dataverse environment information is correct.
- If needed, open the data source credentials section, and select Edit credentials settings to reconfigure the data source.
- After you validate the settings, go back to the app workspace and select Refresh.
- After a successful dataset refresh operation, select the Update App option at the upper-right corner of the app workspace.
Data doesn't appear on the appointments dashboard
The dashboard assumes that the msemr_appointmentstatus field for the appointment entity msemr_appointmentemr has a value. Ensure that your data has values for this field, or configure the dashboard according to the shape of your data.