Manage Azure Native New Relic Service
This article describes how to manage the settings for Azure Native New Relic Service.
Resource overview
Begin by signing in to the Azure portal.
In the working pane under Navigate, select All resources.
From the Resource menu, choose the resource.
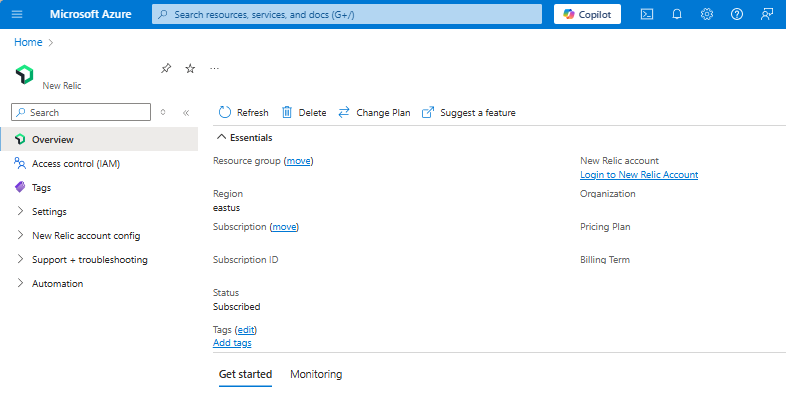
The resource displays in the working pane with the Overview open by default.

The Essentials details include:
- Resource group
- Region
- Subscription
- Tags
- New Relic account
- New Relic organization
- Status
- Pricing plan
- Billing term
To manage your resource, select the links next to corresponding details.
Below the essentials, you can navigate to other details about your resource by selecting a tab.
- The Get started tab provides deep links to New Relic dashboards, logs, and alerts.
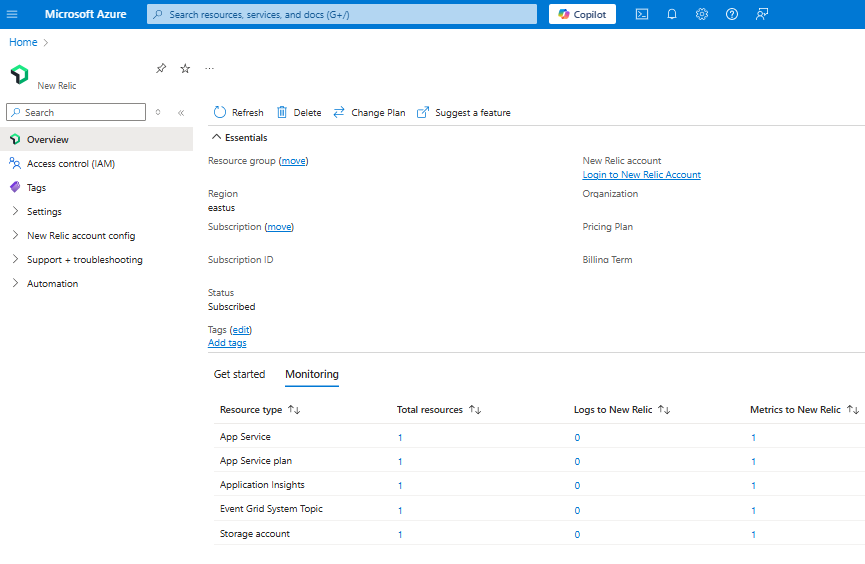
- The Monitoring tab provides a summary of the resources that send logs and metrics to New Relic.
Monitoring tab
If you select Monitoring, the pane that opens includes a table with information about the Azure resources that are sending logs and metrics to New Relic.

The columns in the table denote valuable information for your resource:
| Property | Description |
|---|---|
| Resource type | Azure resource type |
| Total resources | Count of all resources for the resource type |
| Logs to New Relic | Count of logs for the resource type |
| Metrics to New Relic | Count of resources sending metrics to New Relic through the integration |
Reconfigure rules for metrics and logs
To change the configuration rules for metrics and logs, select New Relic account config > Metrics and logs from the Service menu.

View monitored resources
To see the list of resources sending metrics and logs to New Relic, select New Relic account config > Monitored resources from the Service menu.
You can filter the list of resources by resource type, resource group name, region, and whether the resource is sending metrics and logs.
The column Logs to New Relic indicates whether the resource is sending logs to New Relic.
Monitor multiple subscriptions
You can now monitor all your subscriptions through a single New Relic resource using Monitored Subscriptions. You don't have to set up a New Relic resource in every subscription that you intend to monitor. Instead, monitor multiple subscriptions by linking them to a single New Relic resource tied to a New Relic organization to view all resources across multiple subscriptions from a single pane.
To monitor multiple subscriptions:
Select New Relic account config > Monitored Subscriptions from the Service menu.
Select Add subscriptions.
A list of subscriptions displays in the working pane.
Tip
If the subscription you want to monitor has a resource already linked to the same New Relic organization, we recommend deleting one to avoid shipping duplicate data, which results in duplicate charges.
Select the subscriptions you want to monitor through the New Relic resource and select the Add button.
If the list doesn’t update automatically, select Refresh. When the subscription is successfully added, you see the status is updated to Active. If a subscription fails to get added, Monitoring Status shows as Failed.
The set of tag rules for metrics and logs defined for the New Relic resource apply to all subscriptions that are added for monitoring. Setting separate tag rules for different subscriptions isn't supported. Diagnostics settings are automatically added to resources in the added subscriptions that match the tag rules defined for the New Relic resource.
If you have existing New Relic resources that are linked to the account for monitoring, duplication of logs can result in added charges. To prevent duplicate charges, delete redundant New Relic resources that are already linked to the account. We recommended consolidating subscriptions into the same New Relic resource where possible.
The tag rules and logs that you defined for the New Relic resource apply to all the subscriptions that you select to be monitored.
Connected New Relic resources
To view and manage all your New Relic Resources, select New Relic account config > Connected New Relic Resources from the Service menu.
Note
Your Azure role must be set to Owner or a Contributor for the subscription to manage these resources.
New Relic agents
For information on New Relic agents, review the New Relic documentation.
Monitor virtual machines with the New Relic agent
To monitor virtual machines using the New Relic agent:
Select New Relic account config > Virtual Machines from the Service menu.
A list of all virtual machines in the subscription displays in the working pane.
For each virtual machine, the following info appears:
| Property | Description |
|---|---|
| Virtual machine name | Name of the virtual machine. |
| Resource status | Indicates whether the virtual machine is stopped or running. |
| Agent status | Indicates whether the New Relic agent is running on the virtual machine. |
| Agent version | Version number of the New Relic agent. |
Important
- The New Relic agent can be installed only on virtual machines that are running. If the virtual machine is stopped, installing the New Relic agent is disabled.
- If a virtual machine shows that an agent is installed, but the option Uninstall extension is disabled, the agent was configured through a different New Relic resource in the same Azure subscription. To make any changes, go to the other New Relic resource in the Azure subscription.
Monitor Virtual Machine Scale Sets with the New Relic agent
To monitor Virtual Machine Scale Sets using the New Relic Agent:
Select New Relic account config > Virtual Machine Scale Sets from the Service menu.
A list of all Virtual Machine Scale Sets in the subscription displays in the working pane.
Note
In manual upgrade policy, preexisting instances don't receive the extension automatically. The agent status shows as Partially Installed. Upgrade instances by manually installing a New Relic agent for each preexisting virtual machine.
Note
The agent installation dashboard supports the automatic and rolling upgrade policy for Flex orchestration mode in the next release when similar support is available from Virtual Machine Scale Sets Flex resources.
Monitor App Services using the New Relic agent
To monitor App Services using the New Relic Agent:
- Select New Relic account config > App Services from the Service menu.
For each app service, the following information appears:
| Property | Description |
|---|---|
| Resource name | App service name. |
| Resource status | Indicates whether the App service is running or stopped. |
| App Service plan | The plan configured for the app service. |
| Agent status | Status of the agent. |
Important
- App Service extensions only supported for app services that are running on Windows operating systems.
- App Services that use Linux operating systems aren't displayed.
- You can only manage Web App Services. Function Apps aren't supported at this time.
Install a New Relic agent
You can install New Relic agents on Virtual Machine, Virtual Machine Scale Set, or App Service as an extension by selecting Install Extension command bar in the working pane.
Change billing plan
If you'd like to change your billing plan, follow these steps:
From the working pane's command bar, select Change Plan.
The portal retrieves all the available plans.
Choose the appropriate plan and select Change Plan.
Delete a New Relic resource
If you're done using your resource and would like to delete it, follow these steps:
From the working pane's command bar, select Delete.
The Delete Resource pane appears in the sidebar.
Type the name of the resource into the Confirm Delete field.
Choose a reason for deleting the resource.
Select Delete.
Once the resource is deleted, all billing through Azure Marketplace stops for that resource.
Note
If you have other New Relic resources linked to the New Relic account, billing for those other resources continues through Azure Marketplace.