Migrate to Azure Managed Grafana
This guide shows how to migrate content from a local or a cloud-managed Grafana to Azure Managed Grafana using the Azure CLI. The following elements can be migrated automatically:
- data sources
- folders
- library panels
- dashboards
- snapshots
- annotations
Prerequisites
- A Grafana instance to migrate over to Azure Managed Grafana
- An Azure Managed Grafana workspace
- Minimum access required in both workspaces: Grafana Admin
Use the Bash environment in Azure Cloud Shell. For more information, see Quickstart for Bash in Azure Cloud Shell.

If you prefer to run CLI reference commands locally, install the Azure CLI. If you're running on Windows or macOS, consider running Azure CLI in a Docker container. For more information, see How to run the Azure CLI in a Docker container.
If you're using a local installation, sign in to the Azure CLI by using the az login command. To finish the authentication process, follow the steps displayed in your terminal. For other sign-in options, see Sign in with the Azure CLI.
When you're prompted, install the Azure CLI extension on first use. For more information about extensions, see Use extensions with the Azure CLI.
Run az version to find the version and dependent libraries that are installed. To upgrade to the latest version, run az upgrade.
The following instructions show how to migrate content from a Grafana instance to Azure Managed Grafana using the Azure platform.
Tip
Consider migrating content using the Azure CLI, which is the quickest method.
Note
Some of the instructions presented in this tutorial vary slightly depending on the version of Grafana used. This tutorial was created using Grafana 10.
Prerequisites
- A Grafana instance to migrate over to Azure Managed Grafana
- An Azure Managed Grafana workspace
- Minimum access required in both instances: Grafana Admin
Create a service account token
Start by creating a service account token to grant the necessary permissions to access and export content from your Grafana instance.
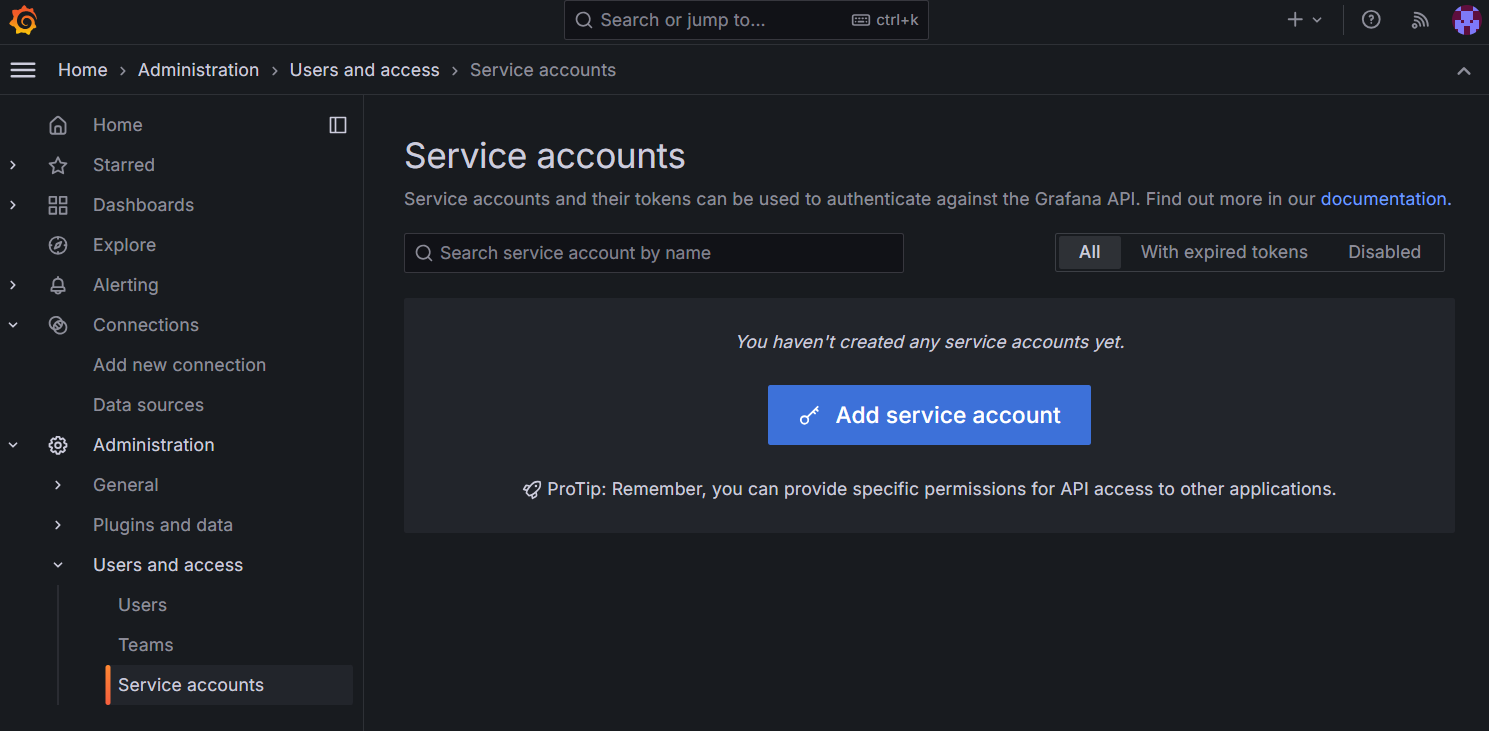
In the Grafana you want to collect content from (source), create a new service account with Admin permissions by going to Administration > Users and access > Service accounts > Add service account.
Tip
This step requires using Grafana service accounts. If you're migrating from an Azure Managed Grafana workspace, enable service accounts in Azure Managed Grafana.
Enter a display name for the new service account, select the Admin role, Apply, and Create.
Once the service account has been created, select Add token, optionally set an expiration date, and select Generate token. Remember to copy the token now as you won't be able to see it again once you leave this page.

Run the Grafana migrate command
In the Azure CLI, run the az grafana migrate command. When running the command below, replace the placeholders <target-grafana> <target-grafana-resource-group> <--src-endpoint>, <source-grafana-endpoint>and <source-token> with the name and resource group of the Azure Managed Grafana workspace you want to migrate to (target), the endpoint of the Grafana you're collecting content from (source), and the service account token you created earlier.
az grafana migrate --name <target-grafana> --resource-group <target-grafana-resource-group> --src-endpoint <source-grafana-endpoint> --src-token-or-key <source-token>
The Azure CLI output lists all the elements that were migrated over to your Azure Managed Grafana workspace.
Optional parameters for this command include:
--dry-run: Preview changes without committing.--folders-to-exclude: Folders to exclude in backup or sync.--folders-to-include: Folders to include in backup or sync.--overwrite: If you try to migrate a dashboard that already exists in your target Grafana workspace, by default, Azure Managed Grafana skips the creation of the new data source to avoid creating a duplicate. The overwrite option lets you overwrite previous dashboards, library panels, and folders with the same uid or title.
Finalize Grafana migration
Go to your target workspace and check that you can find everything you migrated from your Grafana instance.
Important
If your data sources are set up using secrets, you need to manually reconfigure these secrets in your target workspace to successfully configure your data sources.
Export your Grafana dashboards
Start by exporting your Grafana dashboards as JSON files.
Open your Grafana user interface and go Dashboards.
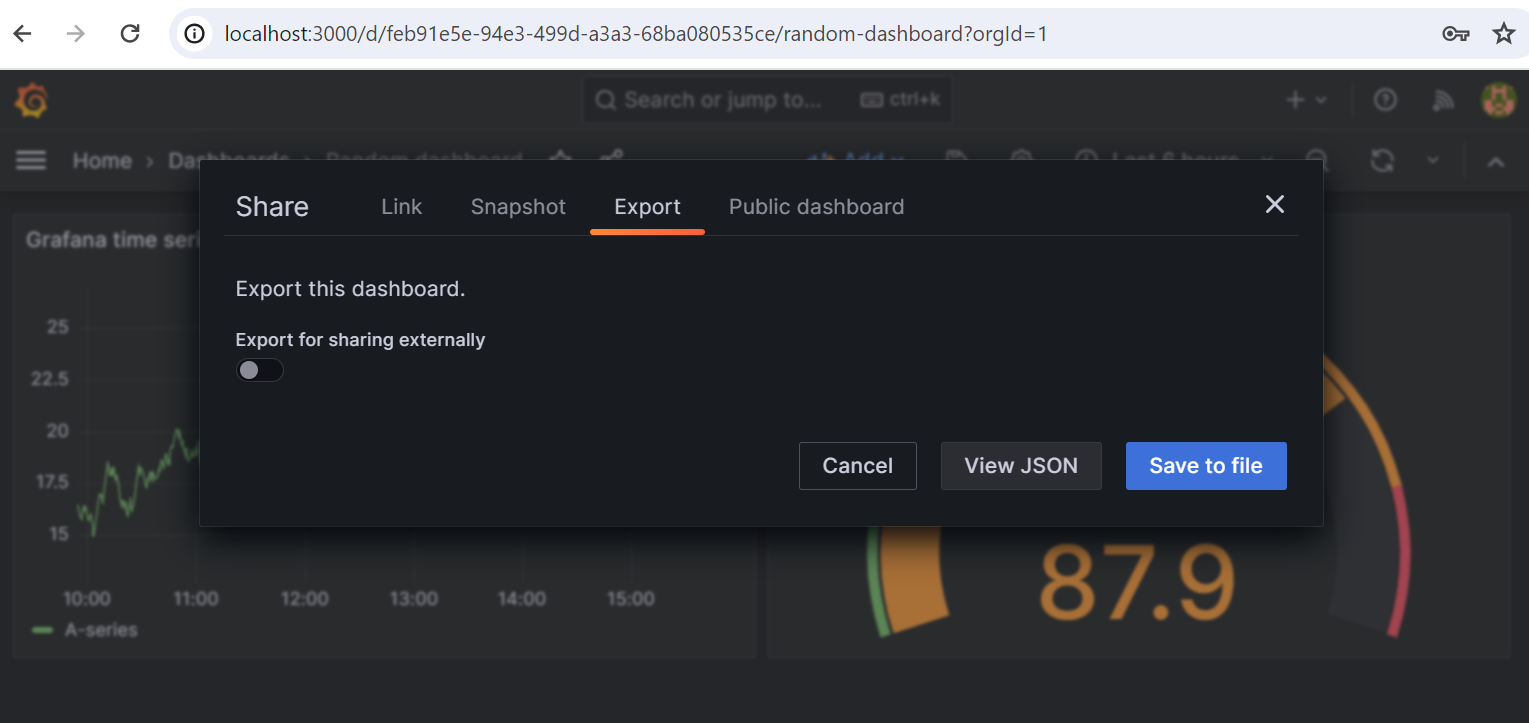
Open one of your dashboards and select the Share panel or dashboard icon.
Go to the Export tab and select Save to file.
Repeat this process for each dashboard you want to export.
Import your Grafana dashboards into Azure Managed Grafana
Create a new dashboard in Azure Managed Grafana by importing the JSON files you exported.
In the Overview page of your Azure Managed Grafana workspace, open the Endpoint URL to open the Grafana portal.
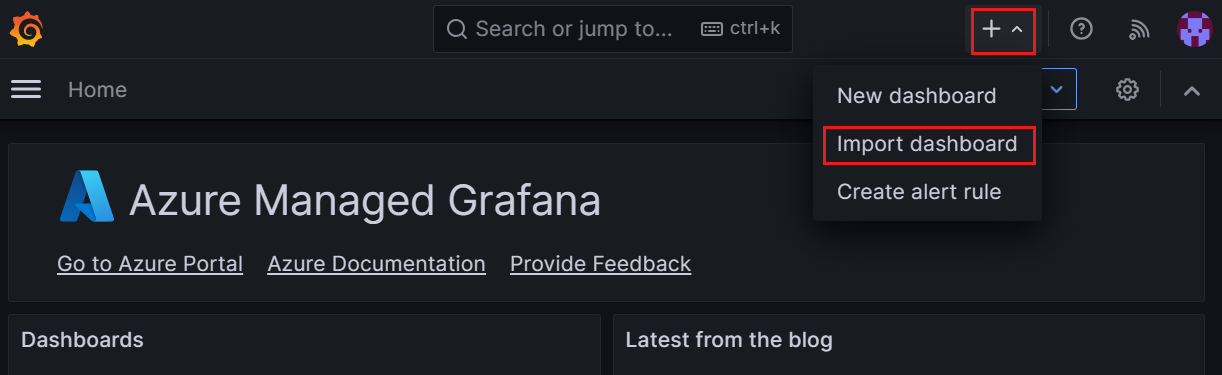
Select + at the top of the page, then Import dashboard.
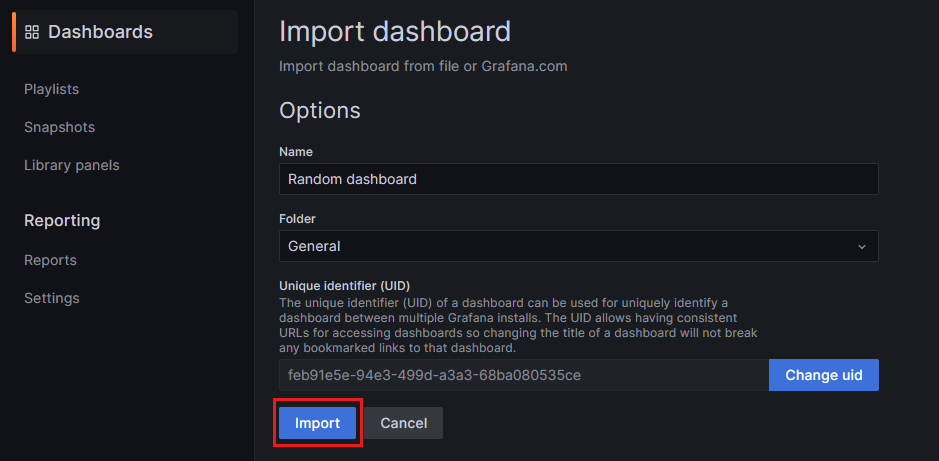
Select Upload dashboard JSON file and select the file on your local machine.
Select Load and review the dashboard settings. Optionally edit the dashboard name, folder, and unique identifier (UID).
Select Import to save the dashboard. Repeat this process for each dashboard you want to import.
For more information about how to create and edit dashboards, go to Create a dashboard in Azure Managed Grafana.
Install data source plugins
Core data source plugins supported by your workspace's pricing plan are installed by default. To install other optional plugins, follow the process below:
- Open your workspace in the Azure portal and go to Plugin management (Preview).
- Choose a plugin to install by selecting its checkbox and select Save.
- Repeat this process for each data source plugin you want to install.
Refer to Add a plugin for more information.
Configure your data sources
Configure your new data sources in Azure Managed Grafana.
- In the Overview page of your Azure Managed Grafana workspace, open the Endpoint URL to open the Grafana portal.
- In the Grafana user interface, go to Connections > Data sources > Add new datasource.
- Select a data source from the list.
- Fill out the required fields and select Save & test to save the configuration and verify that Grafana can connect to the data source.
- Repeat this process for each data source.
Related content
For more information about plugins, data sources, and dashboards, check the following content: