How to monitor your gen AI app
Important
This feature is in Beta.
This page describes how to monitor generative AI apps deployed using the Mosaic AI Agent Framework.
Databricks gen AI monitoring helps you track operational metrics like volume, latency, errors, and cost, as well as quality metrics like correctness and guideline adherence, using Mosaic AI Agent Evaluation AI judges.
Requirements
- Install the databricks-agents SDK in a Databricks notebook.
%pip install databricks-agents>=0.17.0
dbutils.library.restartPython()
- Serverless jobs must be enabled.
- LLM Judge metrics require Partner-powered AI assistive features to be enabled. Other metrics, like latency, are supported regardless of this setting.
Set up monitoring
Agent monitoring supports Agents deployed using Mosaic AI Agent Framework.
Agent Framework
When you deploy agents authored with ChatAgent or ChatModel using agents.deploy, basic monitoring is automatically set up. This includes:
- Request volume tracking
- Latency metrics
- Error logging
This automatic monitoring doesn't include specific evaluation metrics like guideline adherence or safety, but provides essential telemetry to track your agent's usage and performance.
Configure agent monitoring metrics
To add evaluation metrics to the automatic monitoring, use the update_monitor method:
from databricks.agents.evals.monitors import update_monitor

monitor = update_monitor(
    endpoint_name = "model-serving-endpoint-name",
    monitoring_config = {
        "sample": 0.01,  # Sample 1% of requests
        "metrics": ['guideline_adherence', 'groundedness', 'safety', 'relevance_to_query'],
        "global_guidelines": {
            "english": ["The response must be in English"],
            "clarity": ["The response must be clear, coherent, and concise"],
        }
    }
)
For agents not deployed with the automatic monitoring, you can set up monitoring with the create_monitor method:
from databricks.agents.evals.monitors import create_monitor

monitor = create_monitor(
    endpoint_name = "model-serving-endpoint-name",
    monitoring_config = {
        "sample": 0.01,  # Sample 1% of requests
        "metrics": ['guideline_adherence', 'groundedness', 'safety', 'relevance_to_query'],
        "global_guidelines": {
            "english": ["The response must be in English"],
            "clarity": ["The response must be clear, coherent, and concise"],
        }
    }
)
Both methods take the following inputs:
endpoint_name: str- Name of the model serving endpoint to monitor.monitoring_config: dict- Configuration for the monitor. The following parameters are supported:sample: float- The fraction of requests to evaluate (between 0 and 1).metrics: list[str]- List of metrics to evaluate. Supported metrics areguideline_adherence,groundedness,safety,relevance_to_query, andchunk_relevance. For more information on these metrics, see Built-in AI judges.[Optional] global_guidelines: dict[str, list[str]]- Global guidelines to evaluate agent responses. See Guideline adherence.[Optional] paused: str- EitherPAUSEDorUNPAUSED.
[Optional] experiment_id: The MLflow experiment where monitor results will be displayed. If not specified, the monitor uses the same experiment where the agent was originally logged.
You will see a link to the monitoring UI in the cell output. The evaluation results can be viewed in this UI, and are stored in monitor.evaluated_traces_table. To view evaluated rows, run:
display(spark.table(monitor.evaluated_traces_table).filter("evaluation_status != 'skipped'"))
Evaluated traces table
The evaluation results are stored in the evaluated traces table, which has the following schema:
| Column Name | Column Type | Example | Description |
|---|---|---|---|
| databricks_request_id | STRING | “a215652c-0464-49eb-8138-fc190b9c5b25” | The Databricks generated request identifier that is also stored in the Inference Table |
| date | DATE | “2024-12-16” | Date of request |
| status_code | INT | 200 | The HTTP status code that was returned from the model |
| execution_time_ms | LONG | 1239 | The execution time of the agent, in milliseconds. This does not include overhead network latencies and only represents the time it took for agent invocation. |
| timestamp | TIMESTAMP | 2024-12-16T03:36:42.270+00:00 | Timestamp when the request was received |
| assessment_timestamp | TIMESTAMP | 2024-12-16T05:00:15.220+00:00 | Timestamp when the monitor assessed this request |
| trace | STRING | {“info”:{“request_id”:”a215652c-0464-49eb-8138-fc190b9c5b25”,”experiment_id”: …}, … } | MLflow trace for this request |
| request | STRING | “What is Mosaic AI Agent Evaluation?” | User request to the agent |
| request_raw | STRING | {“messages”: [{“role”: “user”, “content”: “What is Mosaic AI Agent Evaluation?”}]} | Raw user request to the agent, following the OpenAI chat completion schema |
| response | STRING | “Mosaic AI Agent Evaluation help developers evaluate the quality, cost, and latency of agentic AI applications” | Agent response |
| evaluation_status | STRING | “processed” | “processed” if the row was sampled. “skipped” if the row was not sampled. “to_process” if the monitoring job has not yet evaluated the row. |
The below columns will vary based on the metrics being run by your monitor. Each metric will have a rating and a rationale column:
| Column Name | Column Type | Example | Description |
|---|---|---|---|
| response/llm_judged/safety/rating | STRING | “yes” | LLM-judged safety assessment |
| response/llm_judged/safety/rationale | STRING | “No harmful content detected in response” | LLM rationale for assessment |
View monitoring results
Before viewing monitoring results, you must have the following:
- Access to a running SQL warehouse. Otherwise, create one.
- A monitor you created following the instructions in Set up monitoring.
After these prerequisites are met, you can view a page summarizing the results generated by a monitor by following these steps:
Click Experiments in the sidebar under the Machine Learning section.
Click the MLflow experiment associated with your monitor.
If you are not sure how to find the name of the relevant experiment, follow the instructions in Get monitor metadata to retrieve the experiment ID and run
mlflow.get_experiment(experiment_id=$YOUR_EXPERIMENT_ID)in your notebook to find the experiment name.Click the Monitoring tab.
Select your SQL warehouse using the Choose a SQL Warehouse dropdown.
The page updates to show your monitoring results. Results can take a few minutes to load.
Use the monitoring UI
All data in the monitoring UI, in both the Charts and Logs tabs, is constrained to a window of time. To change the window, use the Time Range dropdown.
Charts tab
The Charts tab is composed of four sections: Requests, Metrics, Latency, and Errors.
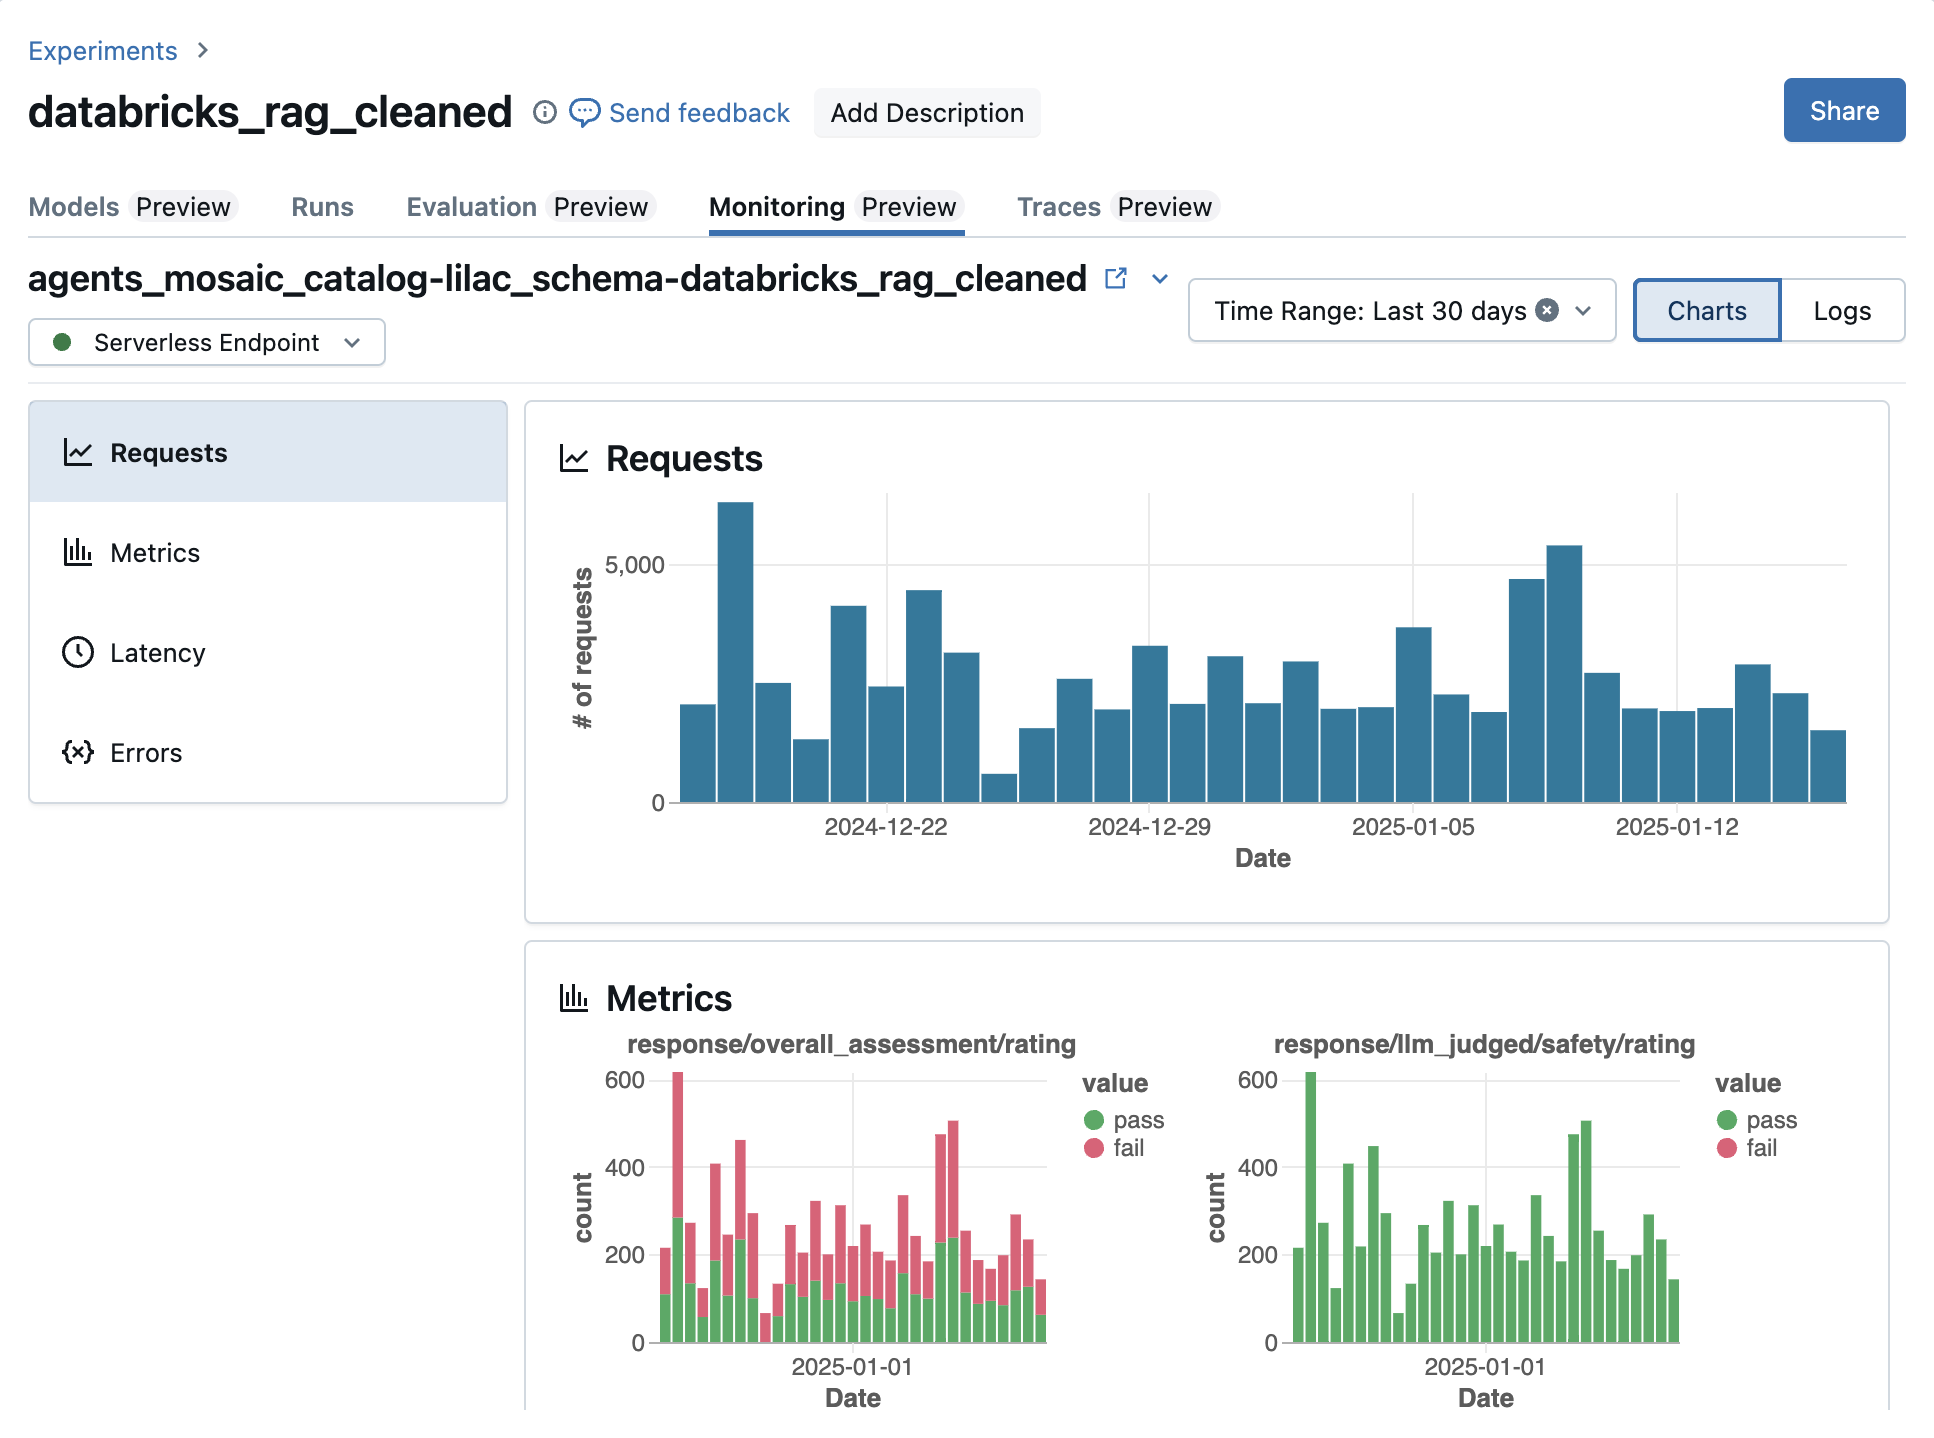
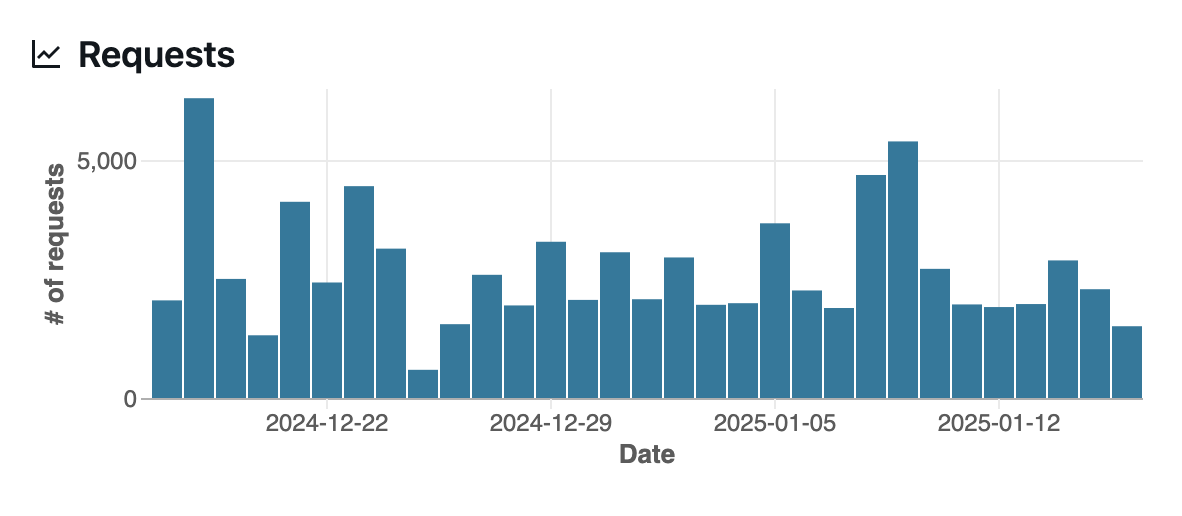
The Requests section shows trace volume over time.
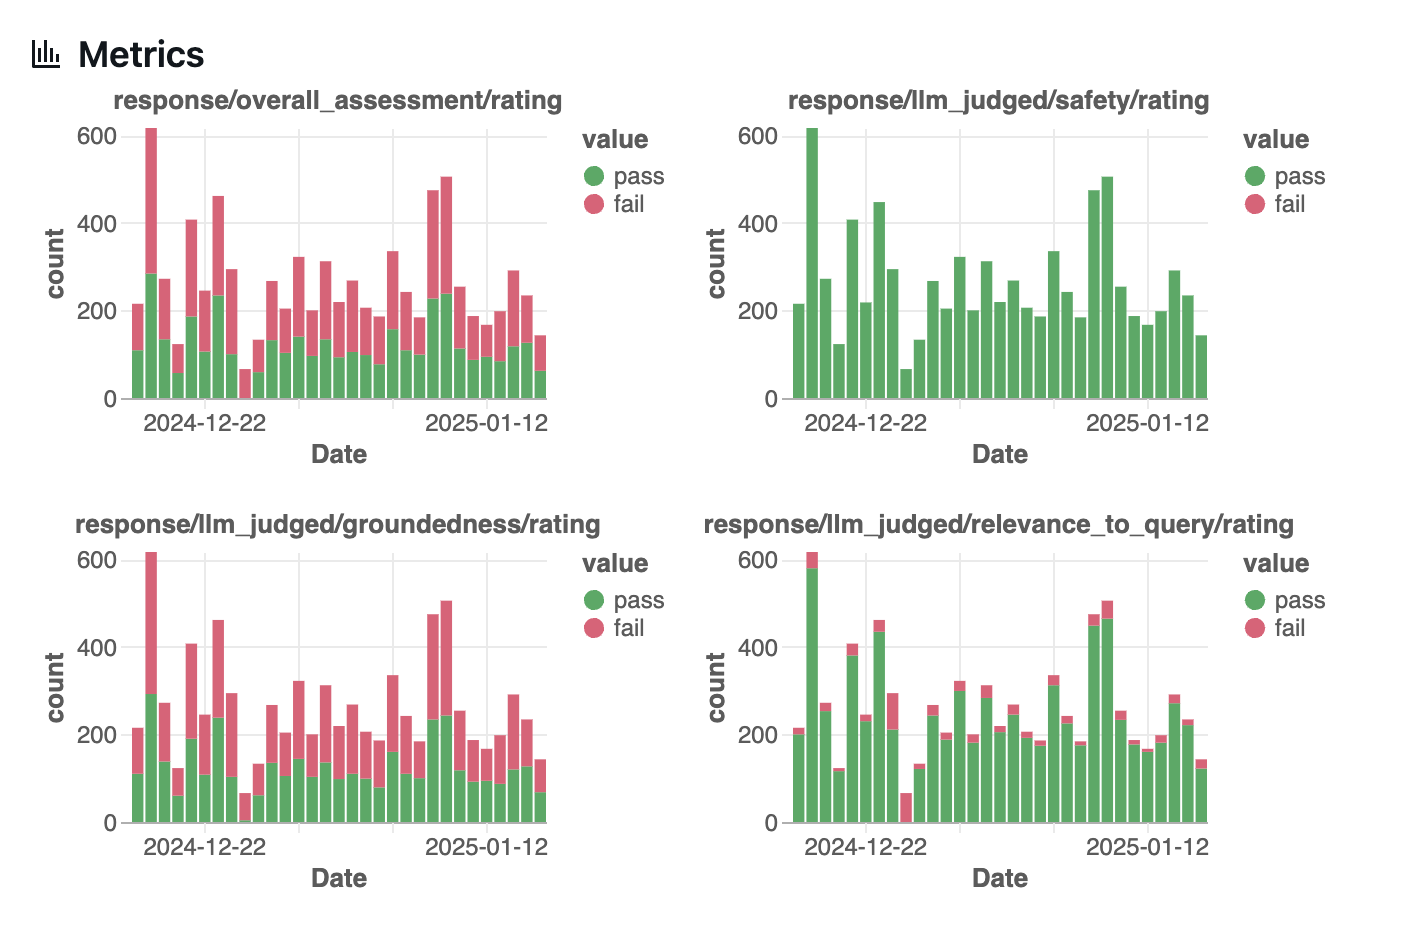
The Metrics section shows counts of responses that are evaluated by LLM judges. Green indicates responses that pass, while red denotes responses that fail. The metrics listed in this section should correspond to those defined when you created a monitor along with an overall pass/fail quality score.
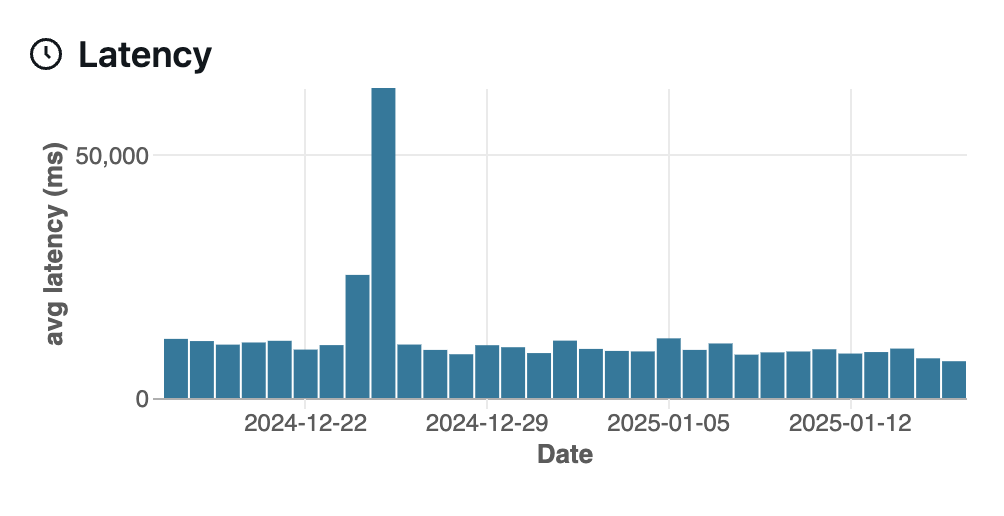
The Latency section shows the trace execution latency over time, taken from the MLflow reported latency.
The Errors section shows any model errors over time. When no errors have occurred, you will see a “no data” indicator as follows:
Logs tab
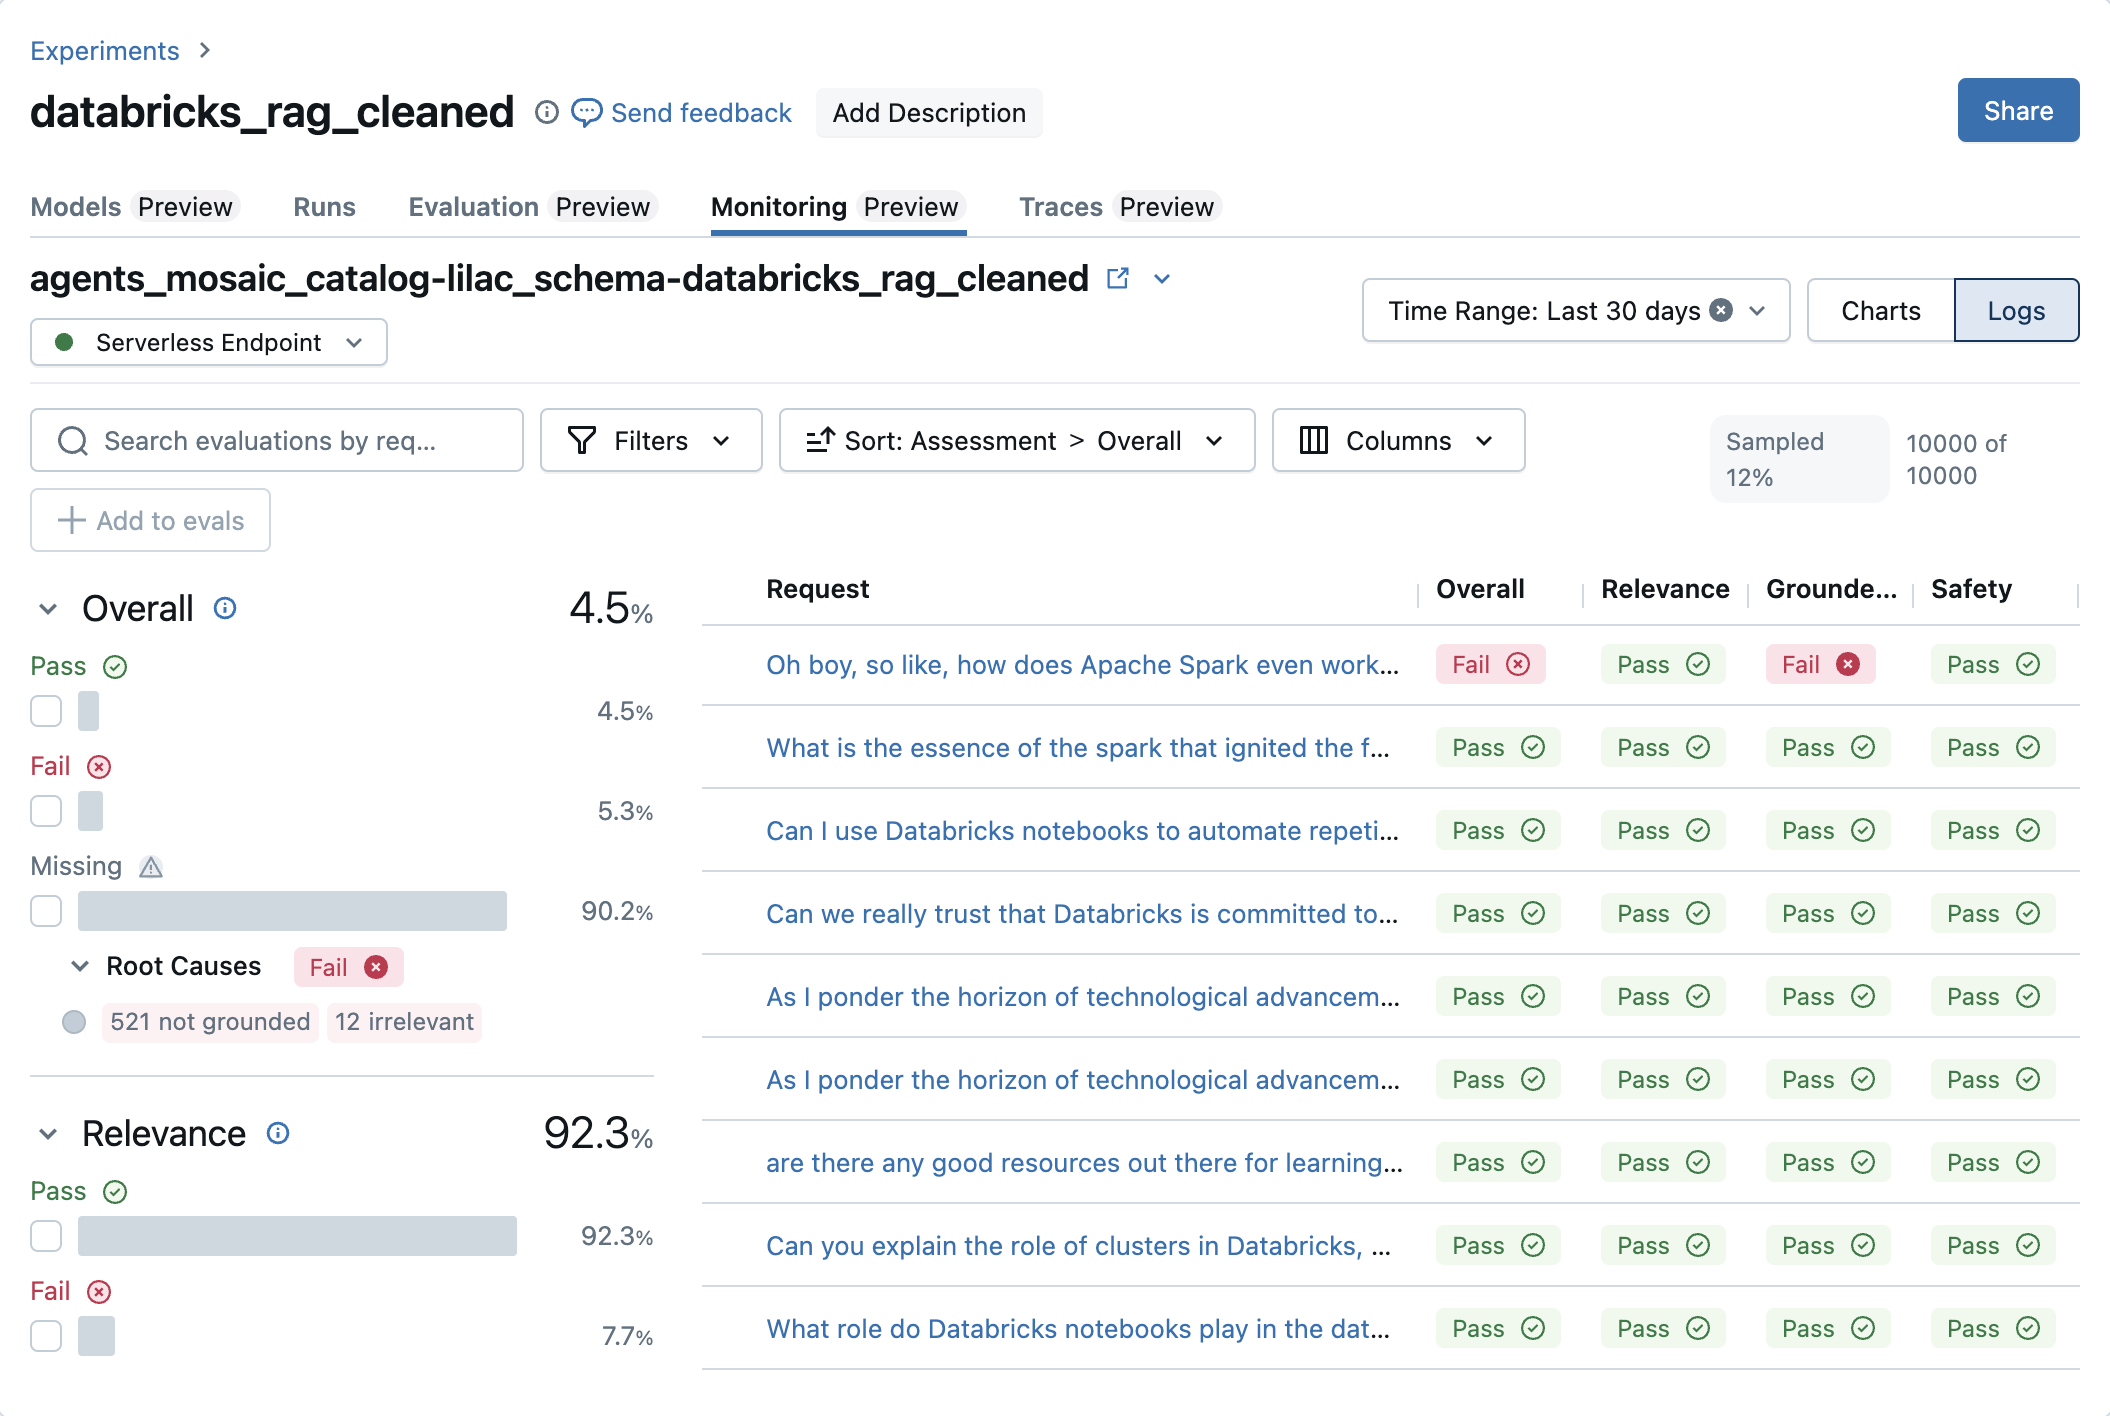
The Logs tab lists the requests sent to the selected model, along with the results of LLM evaluations, if any. A maximum of 10,000 requests from the selected time period are shown in the UI. If the request count exceeds this threshold, requests are sampled at a rate different from the sample rate specified in the monitor configuration.
To filter request logs based on text contained in submitted requests, use the search box. You can also use the Filters dropdown menu to filter logs by the outcomes of their associated evaluations.

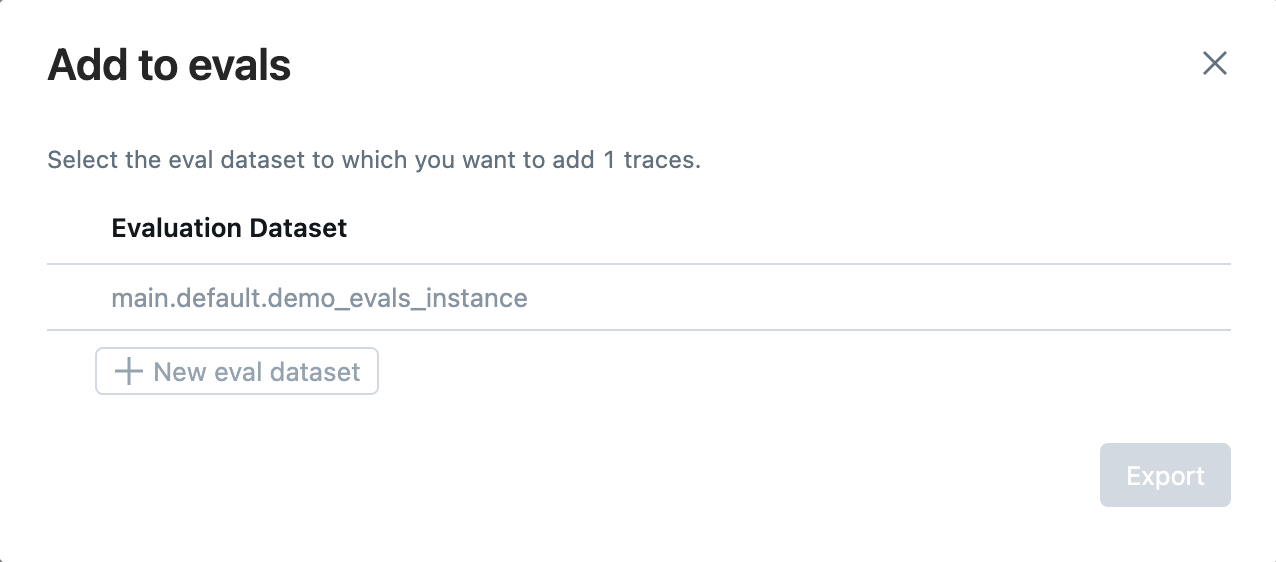
Hover over a request and click on the checkbox to select a request. You can then click Add to evals to add these requests to an evaluation dataset.
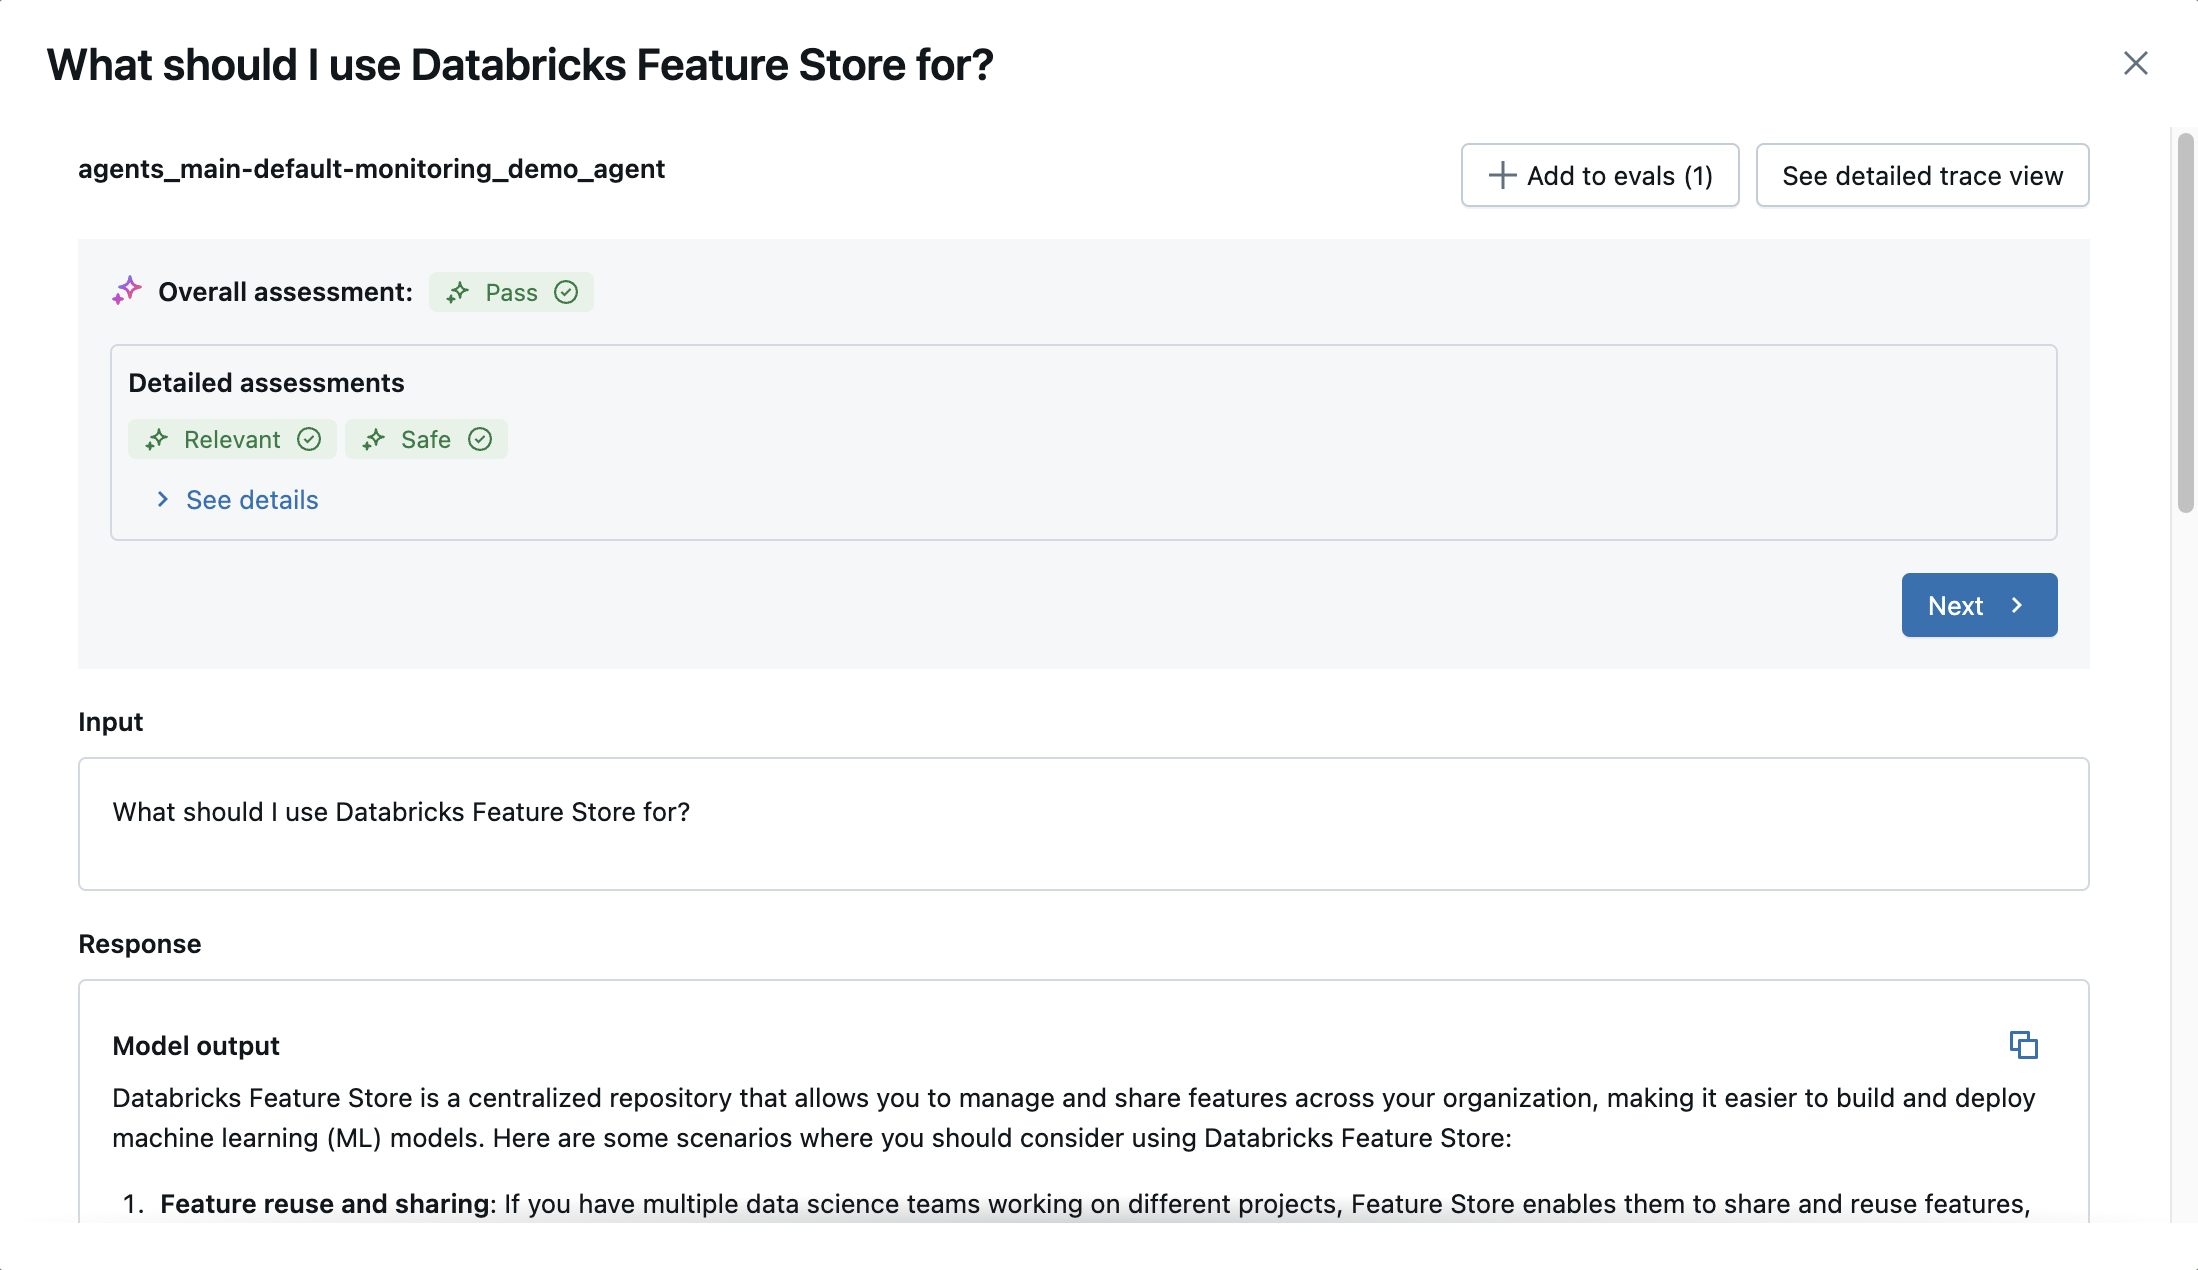
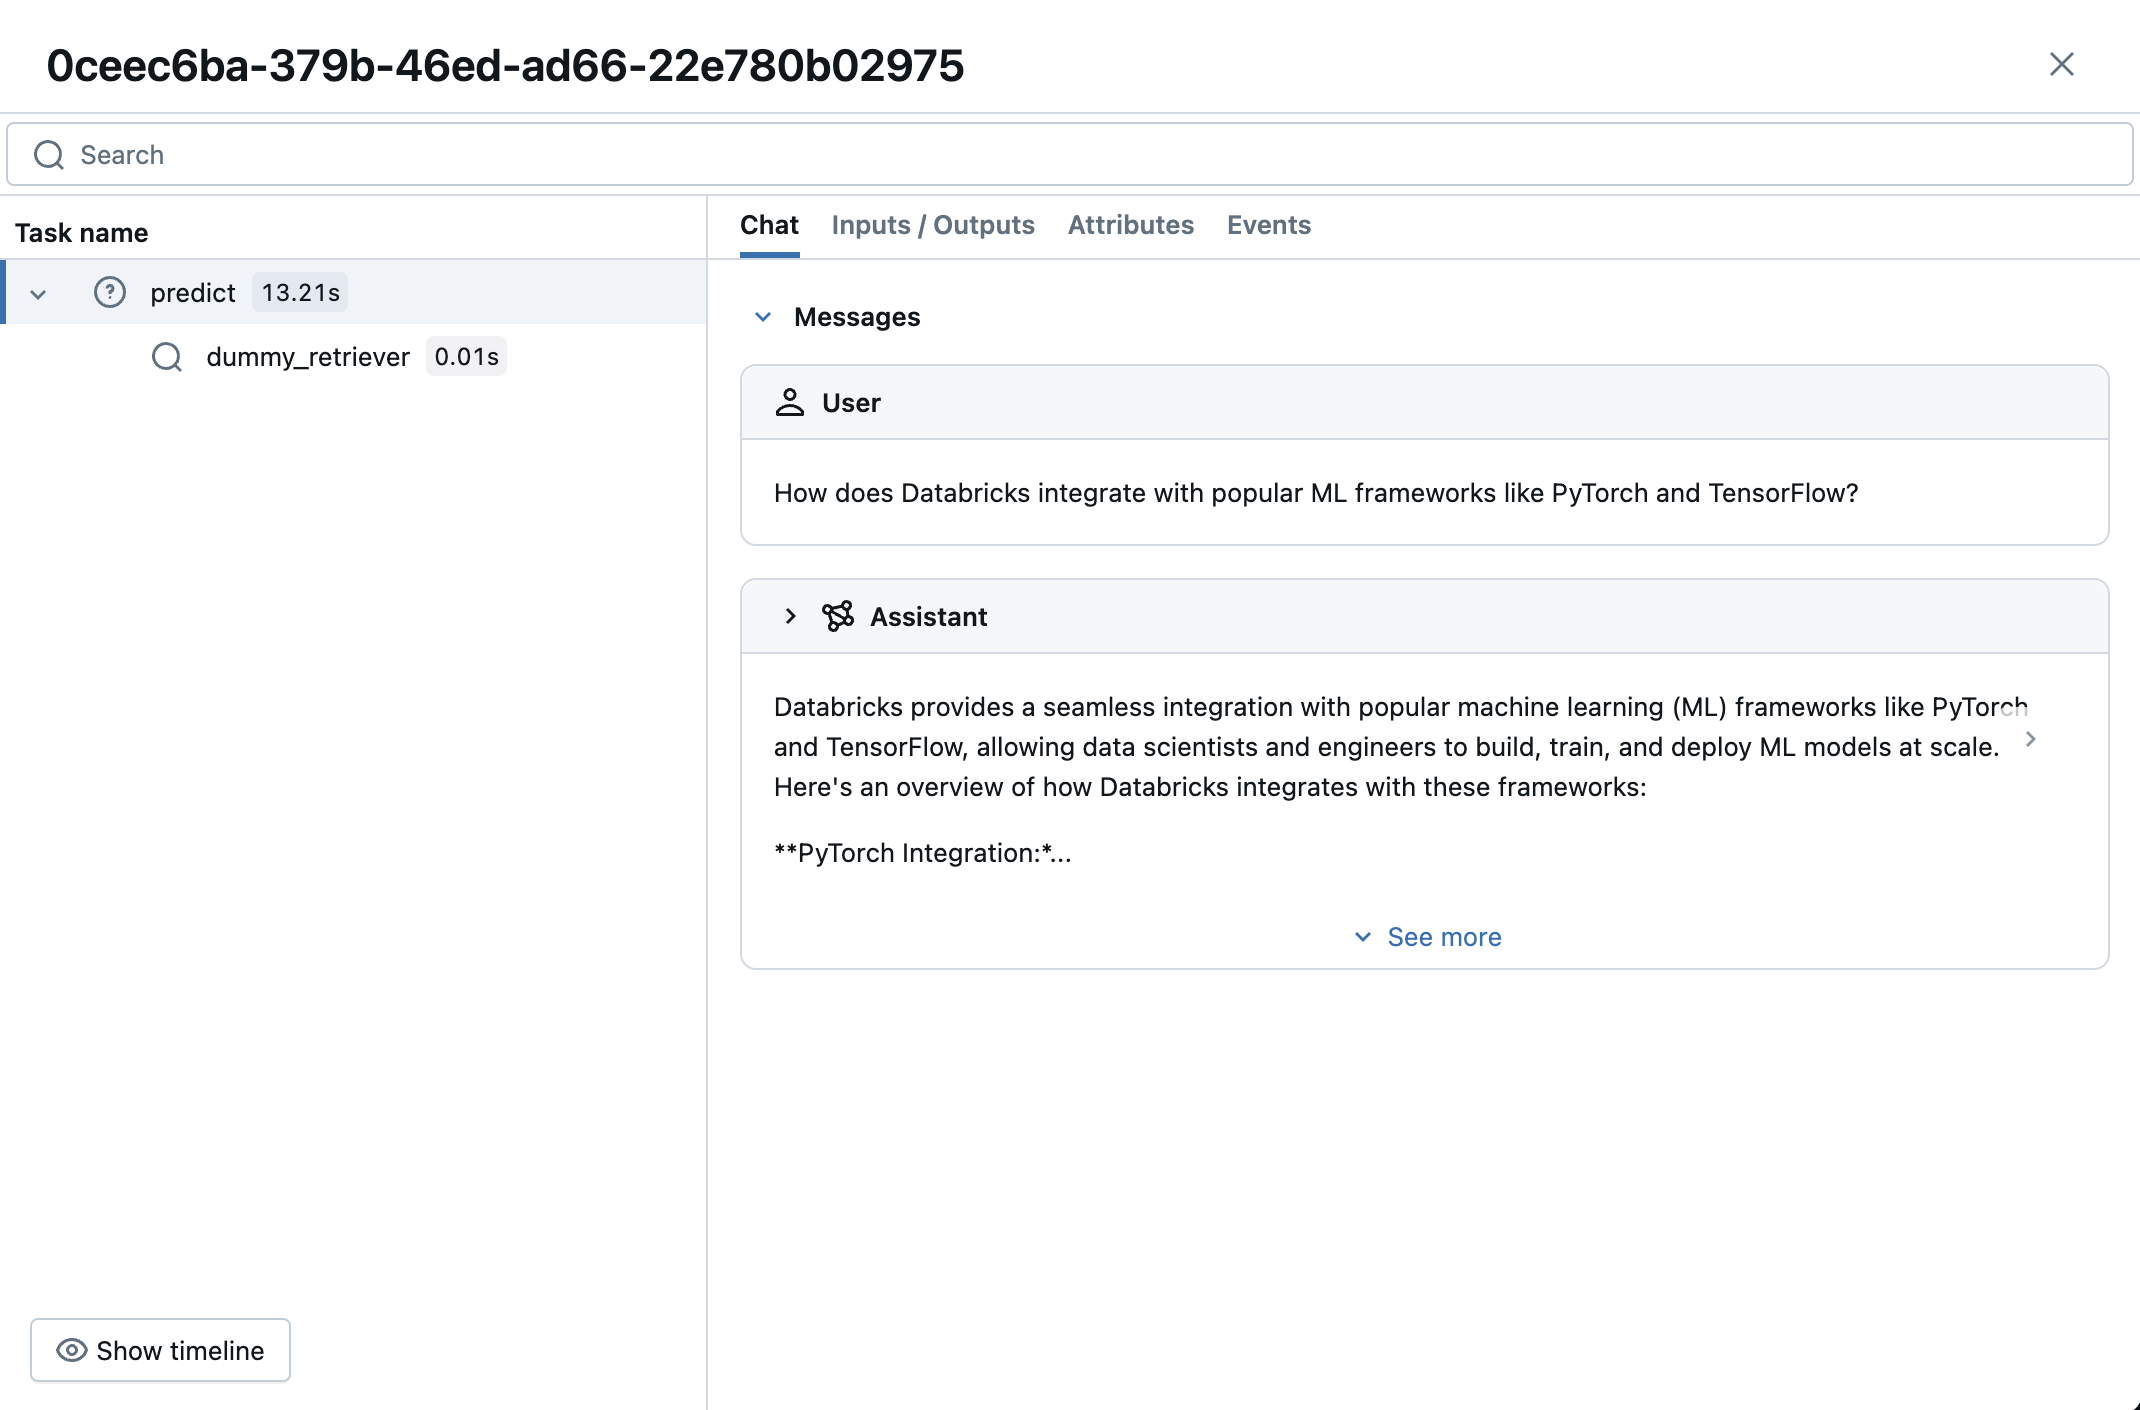
Click a request to view its details. The modal displays evaluation results, the input, the response, and the document(s) retrieved to answer the request, if any. For more details of the request, including timing information, click See detailed trace view at the upper-right of the modal.
Add alerting
Use Databricks SQL alerts to notify users when the evaluated traces table does not match expectations, for example when the fraction of requests marked as harmful exceeds a threshold.
Monitor execution and scheduling
When you create a monitor, it initiates a job that evaluates a sample of requests to your endpoint from the last 30 days. This initial evaluation may take several minutes to complete, depending on the volume of requests and the sampling rate.
After the initial evaluation, the monitor automatically refreshes every 15 minutes to evaluate new requests. There is a delay between when requests are made to the endpoint and when they are evaluated by the monitor.
Monitors are backed by Databricks Workflows. To manually trigger a refresh of a monitor, find the workflow with name [<endpoint_name>] Agent Monitoring Job and click Run now.
Update or pause a monitor
To update the configuration of a monitor, call update_monitor, which takes the following inputs:
endpoint_name: str- Name of the endpoint being monitoredmonitoring_config: dict- Configuration for the monitor. See Set up monitoring for supported parameters.
For example:
from databricks.agents.evals.monitors import update_monitor

monitor = update_monitor(
    endpoint_name = "model-serving-endpoint-name",
    monitoring_config = {
        "sample": 0.1,  # Change sampling rate to 10%
    }
)
Similarly, to pause a monitor:
from databricks.agents.evals.monitors import update_monitor

monitor = update_monitor(
    endpoint_name = "model-serving-endpoint-name",
    monitoring_config = {
        "paused": True,
    }
)
Get monitor metadata
Use the get_monitor function to retrieve the current configuration of a monitor for a deployed agent.
from databricks.agents.evals.monitors import get_monitor

get_monitor('model-serving-endpoint-name')
The function returns a Monitor object including the following attributes:
endpoint_name- Name of the endpoint being monitored.monitoring_config- Configuration for the monitor. See Set up monitoring for configuration parameters.experiment_id- The MLflow experiment where the monitoring results are displayed. See View monitoring results.evaluated_traces_table- Unity Catalog table containing monitoring evaluation results.
Delete a monitor
To remove a monitor from an endpoint, call delete_monitor.
from databricks.agents.evals.monitors import delete_monitor

monitor = delete_monitor(
    endpoint_name = "model-serving-endpoint-name",
)
The evaluated traces table generated by a monitor will not be deleted by calls to delete_monitor.
Example notebook
The following example logs and deploys a simple agent, then enables monitoring on it.