Azure Bastion monitoring data reference
This article contains all the monitoring reference information for this service.
See Monitor Azure Bastion for details on the data you can collect for and how to use it.
Metrics
This section lists all the automatically collected platform metrics for this service. These metrics are also part of the global list of all platform metrics supported in Azure Monitor.
For information on metric retention, see Azure Monitor Metrics overview.
Note
We don't recommend that your use Classic Metrics.
Supported metrics for microsoft.network/bastionHosts
The following table lists the metrics available for the microsoft.network/bastionHosts resource type.
- All columns might not be present in every table.
- Some columns might be beyond the viewing area of the page. Select Expand table to view all available columns.
Table headings
- Category - The metrics group or classification.
- Metric - The metric display name as it appears in the Azure portal.
- Name in REST API - The metric name as referred to in the REST API.
- Unit - Unit of measure.
- Aggregation - The default aggregation type. Valid values: Average (Avg), Minimum (Min), Maximum (Max), Total (Sum), Count.
- Dimensions - Dimensions available for the metric.
- Time Grains - Intervals at which the metric is sampled. For example,
PT1Mindicates that the metric is sampled every minute,PT30Mevery 30 minutes,PT1Hevery hour, and so on. - DS Export- Whether the metric is exportable to Azure Monitor Logs via diagnostic settings. For information on exporting metrics, see Create diagnostic settings in Azure Monitor.
Category: Availability
| Metric | Name in REST API | Unit | Aggregation | Dimensions | Time Grains | DS Export |
|---|---|---|---|---|---|---|
| Bastion Communication Status Communication status shows 1 if all communication is good and 0 if its bad. |
pingmesh |
Count | Average | <none> | PT1M | No |
Category: Saturation
| Metric | Name in REST API | Unit | Aggregation | Dimensions | Time Grains | DS Export |
|---|---|---|---|---|---|---|
| Total Memory Total memory stats. |
total |
Count | Average | host |
PT1M | Yes |
| CPU Usage CPU Usage stats. |
usage_user |
Count | Average | cpu, host |
PT1M | No |
| Memory Usage Memory Usage stats. |
used |
Count | Average | host |
PT1M | Yes |
Category: Traffic
| Metric | Name in REST API | Unit | Aggregation | Dimensions | Time Grains | DS Export |
|---|---|---|---|---|---|---|
| Session Count Sessions Count for the Bastion. View in sum and per instance. |
sessions |
Count | Total (Sum), Average | host |
PT5M, PT15M | No |
Note
The Bastion Communication Status metric only applies to Azure Bastion hosts deployed after November 2020.
Metrics details
The following sections give details about the metrics in the preceding table.
Bastion communication status
You can view the communication status of Azure Bastion, aggregated across all instances comprising the bastion host.
- A value of 1 indicates that the bastion is available.
- A value of 0 indicates that the bastion service is unavailable.
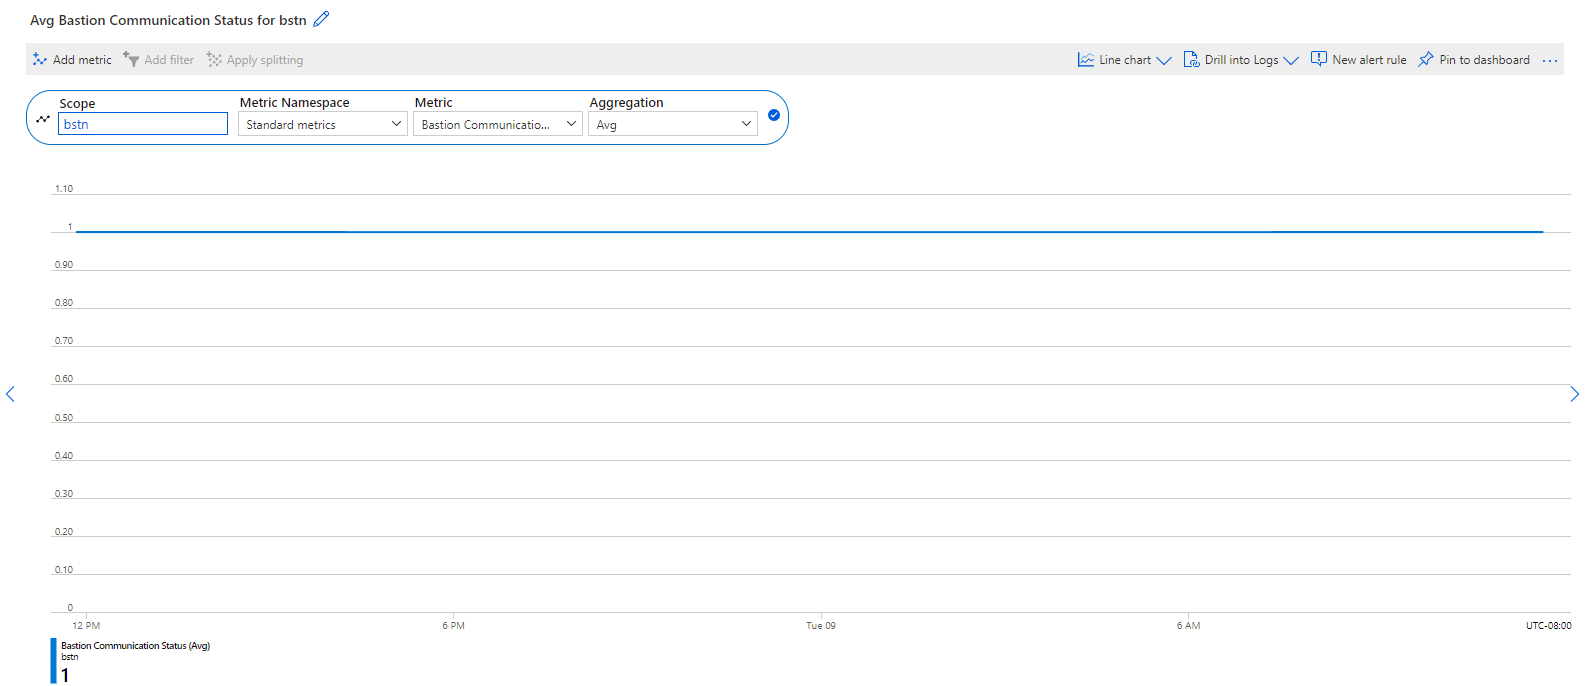
Bastion communication status is an Availability metric.
Session count
You can view the count of active sessions per bastion instance, aggregated across each session type (RDP and SSH). Each Azure Bastion can support a range of active RDP and SSH sessions. Monitoring this metric helps you to understand if you need to adjust the number of instances running the bastion service. For more information about the session count Azure Bastion can support, see the Azure Bastion FAQ.
The recommended values for this metric's configuration are:
- Aggregation: Avg
- Granularity: 5 or 15 minutes
- Splitting by instances is recommended to get a more accurate count
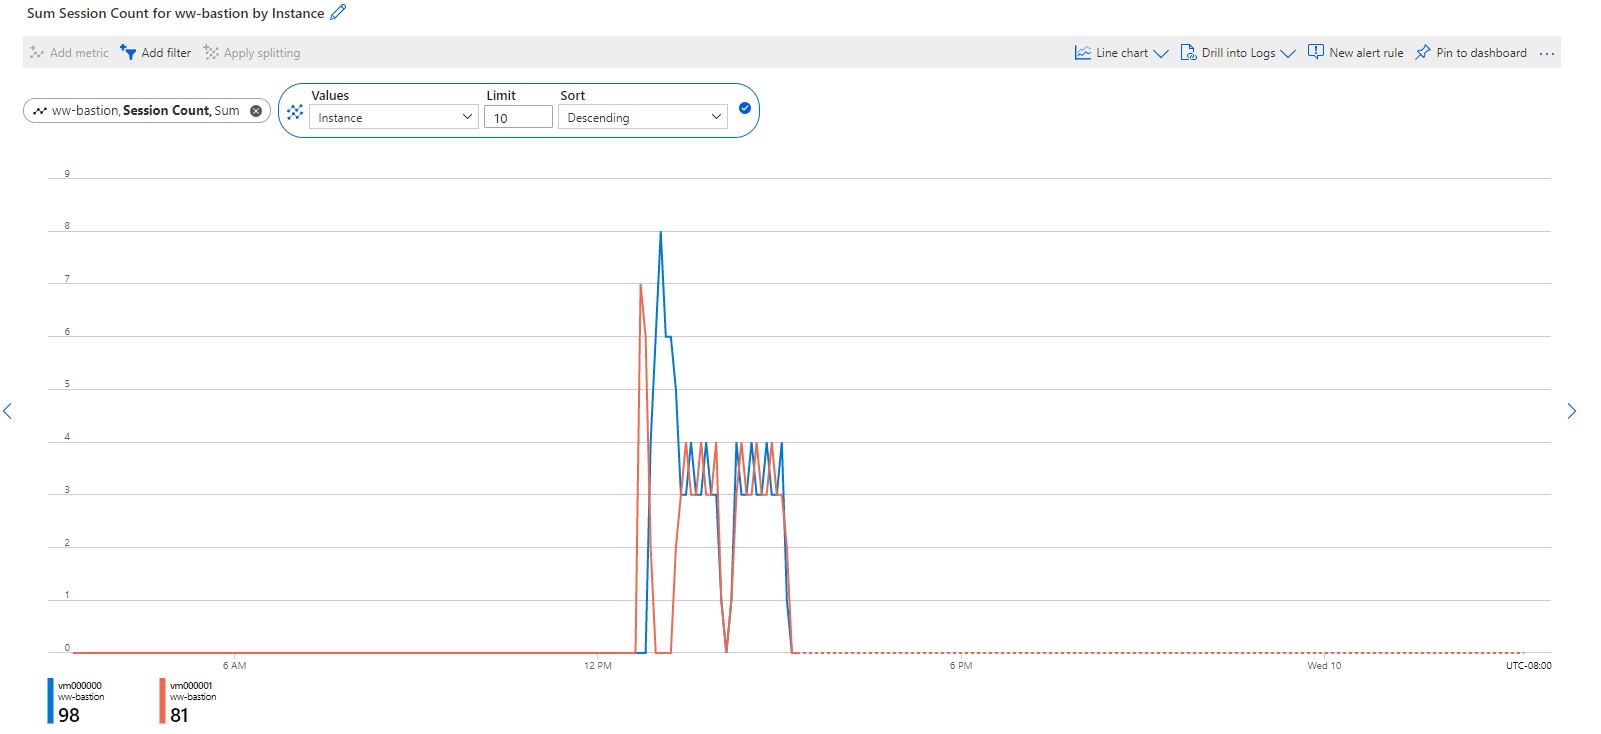
Session count is a Traffic metric.
Total memory
You can view the total memory of Azure Bastion, split across each bastion instance.
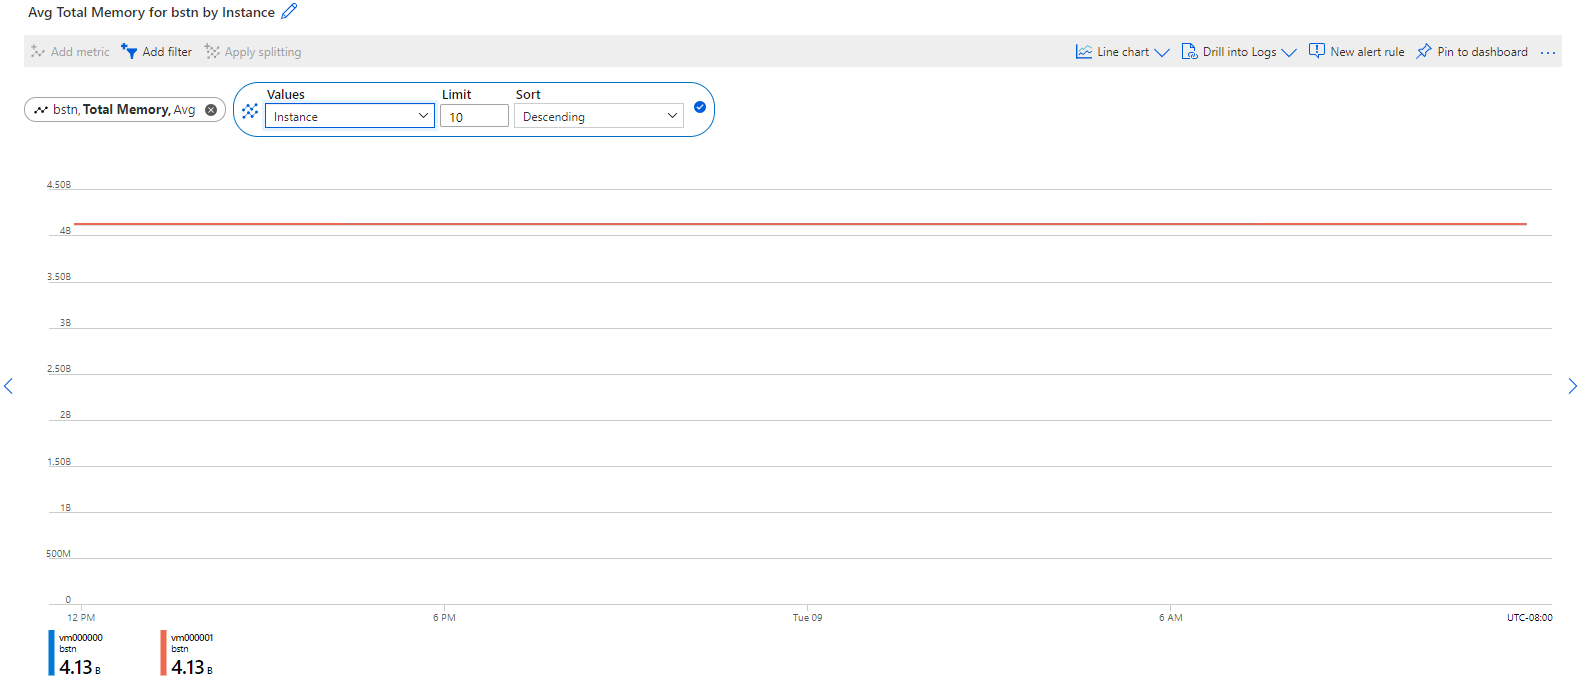
Total memory is a Saturation metric.
CPU usage
You can view the CPU utilization of Azure Bastion, split across each bastion instance. Monitoring this metric helps gauge the availability and capacity of the instances that comprise Azure Bastion.
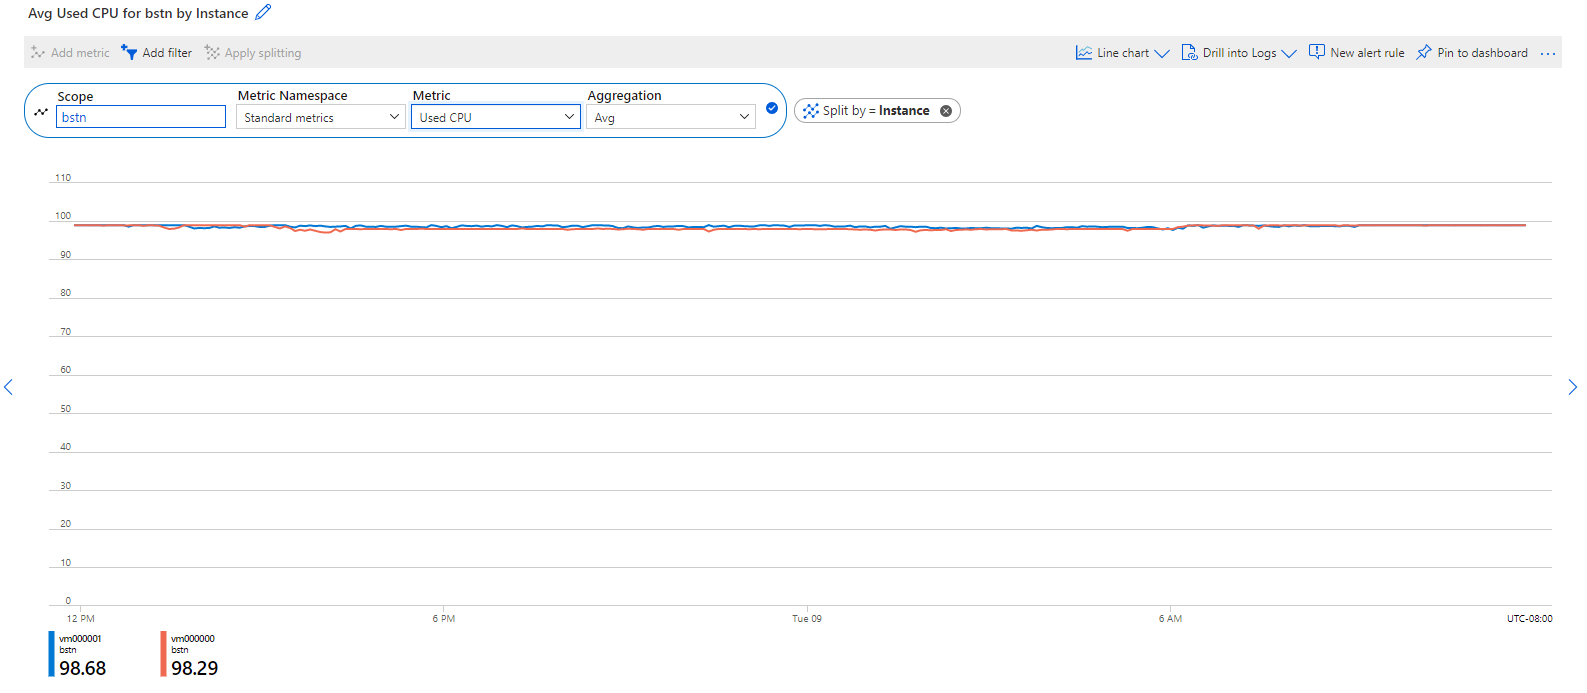
CPU usage is a Saturation metric.
Memory usage
You can view memory utilization across each bastion instance, split across each bastion instance. Monitoring this metric helps gauge the availability and capacity of the instances that comprise Azure Bastion.
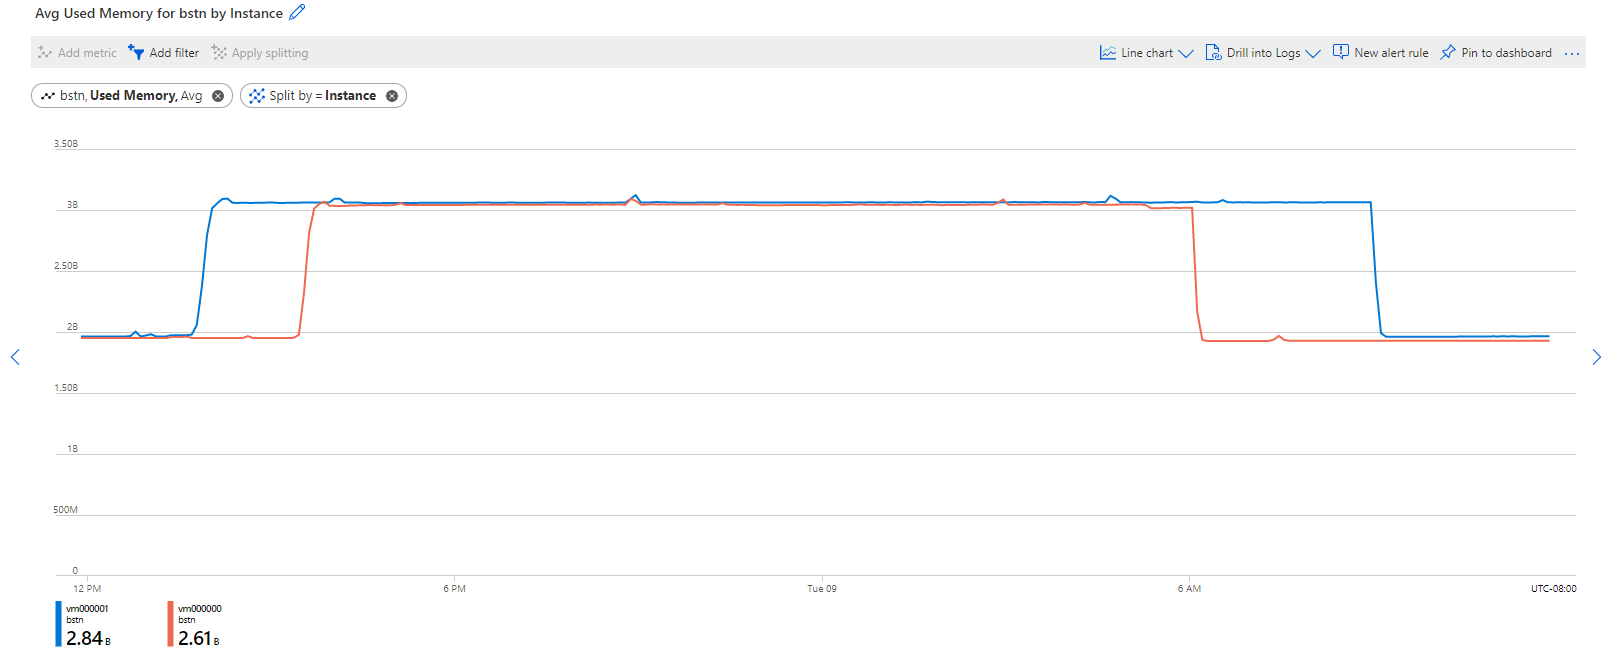
Memory usage is a Saturation metric.
Metric dimensions
For information about what metric dimensions are, see Multi-dimensional metrics.
This service has the following dimensions associated with its metrics.
- cpu
- host
Resource logs
This section lists the types of resource logs you can collect for this service. The section pulls from the list of all resource logs category types supported in Azure Monitor.
Supported resource logs for microsoft.network/bastionHosts
| Category | Category display name | Log table | Supports basic log plan | Supports ingestion-time transformation | Example queries | Costs to export |
|---|---|---|---|---|---|---|
BastionAuditLogs |
Bastion Audit Logs | MicrosoftAzureBastionAuditLogs Microsoft Azure Bastion Audit Logs |
No | Yes | No |
Azure Monitor Logs tables
This section lists the Azure Monitor Logs tables relevant to this service, which are available for query by Log Analytics using Kusto queries. The tables contain resource log data and possibly more depending on what is collected and routed to them.
Azure Bastion microsoft.network/bastionHosts
Activity log
The linked table lists the operations that can be recorded in the activity log for this service. These operations are a subset of all the possible resource provider operations in the activity log.
For more information on the schema of activity log entries, see Activity Log schema.
Related content
- See Monitor Azure Bastion for a description of monitoring Azure Bastion.
- See Monitor Azure resources with Azure Monitor for details on monitoring Azure resources.