Create diagnostic settings in Azure Monitor
Create and edit diagnostic settings in Azure Monitor to send Azure platform metrics and logs to different destinations like Azure Monitor Logs, Azure Storage, or Azure Event Hubs. You can use different methods to work with the diagnostic settings, such as the Azure portal, the Azure CLI, PowerShell, and Azure Resource Manager.
Important
The Retention Policy as set in the Diagnostic Setting settings is now deprecated and can no longer be used. Use the Azure Storage Lifecycle Policy to manage the length of time that your logs are retained. For more information, see Migrate diagnostic settings storage retention to Azure Storage lifecycle management
You can configure diagnostic settings in the Azure portal either from the Azure Monitor menu or from the menu for the resource.
Where you configure diagnostic settings in the Azure portal depends on the resource:
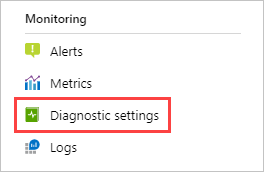
For a single resource, select Diagnostic settings under Monitoring on the resource's menu.
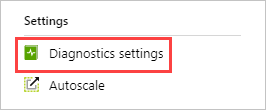
For one or more resources, select Diagnostic settings under Settings on the Azure Monitor menu and then select the resource.
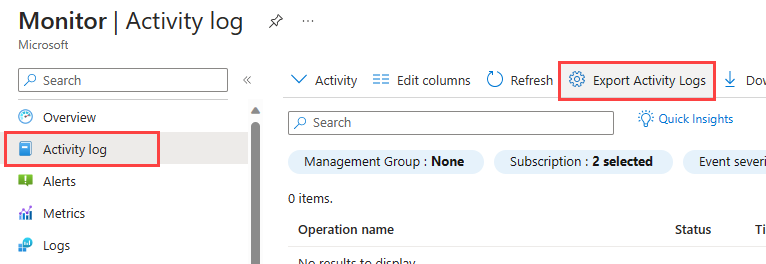
For the activity log, select Activity log on the Azure Monitor menu and then select Export Activity Logs. Make sure you disable any legacy configuration for the activity log. For instructions, see Disable existing settings.
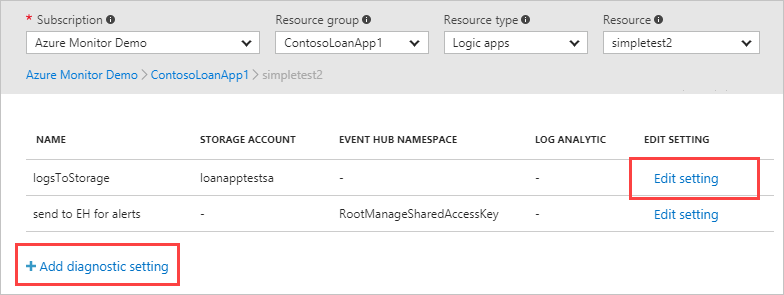
If no settings exist on the resource you select, you're prompted to create a setting. Select Add diagnostic setting.
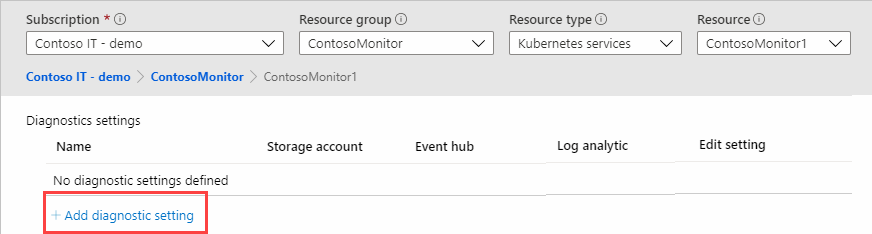
If there are existing settings on the resource, you see a list of settings already configured. Select Add diagnostic setting to add a new setting. Or select Edit setting to edit an existing one. Each setting can have no more than one of each of the destination types.
Give your setting a name if it doesn't already have one.
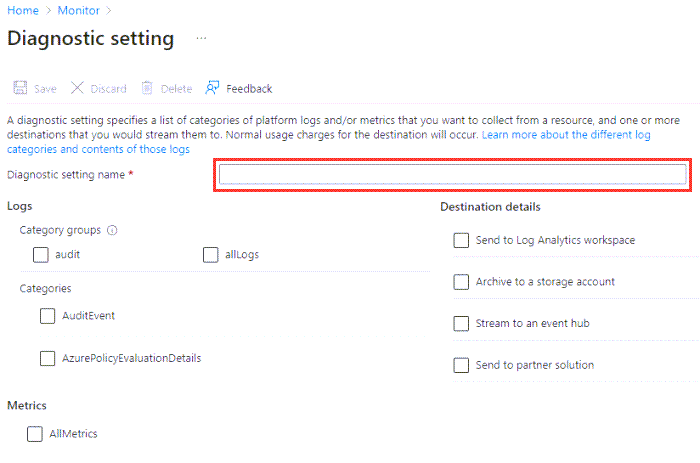
Logs and metrics to route: For logs, either choose a category group or select the individual checkboxes for each category of data you want to send to the destinations specified later. The list of categories varies for each Azure service. Select AllMetrics if you want to store metrics in Azure Monitor Logs too.
Destination details: Select the checkbox for each destination. Options appear so that you can add more information.
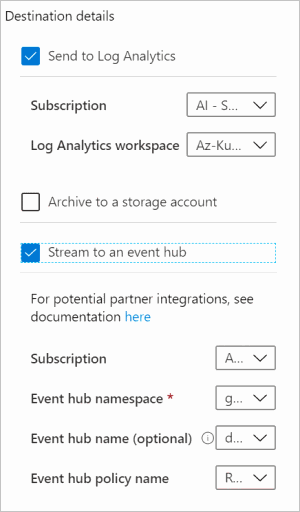
Send to Log Analytics workspace: Select your Subscription and the Log Analytics workspace where you want to send the data. If you don't have a workspace, you must create one before you proceed.
Archive to a storage account: Select your Subscription and the Storage account where you want to store the data.
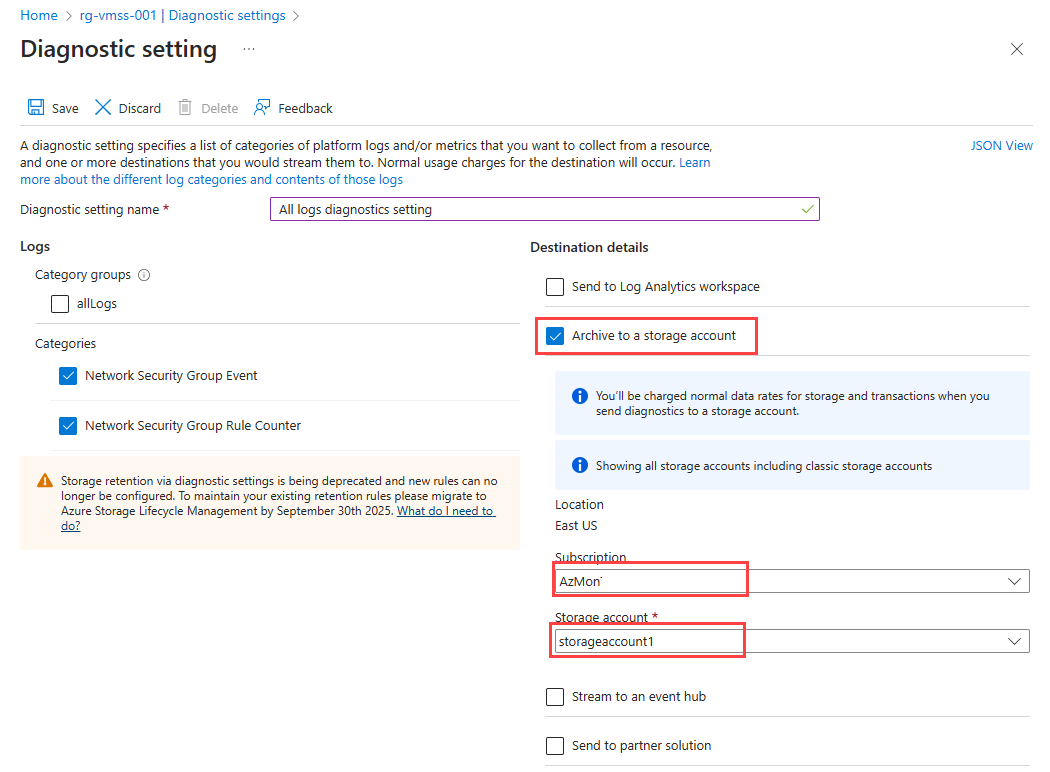
Tip
Use the Azure Storage Lifecycle Policy to manage the length of time that your logs are retained. The Retention Policy as set in the Diagnostic Setting settings is now deprecated.
Stream to an event hub: Specify the following criteria:
- Subscription: The subscription that the event hub is part of.
- Event hub namespace: If you don't have one, you must create one.
- Event hub name (optional): The name to send all data to. If you don't specify a name, an event hub is created for each log category. If you're sending to multiple categories, you might want to specify a name to limit the number of event hubs created. For more information, see Azure Event Hubs quotas and limits.
- Event hub policy name (also optional): A policy defines the permissions that the streaming mechanism has. For more information, see Event Hubs features.
Send to partner solution: You must first install Azure Native ISV Services into your subscription. Configuration options vary by partner. For more information, see Azure Native ISV Services overview.
If the service supports both resource-specific and Azure diagnostics mode, then an option to select the destination table displays when you select Log Analytics workspace as a destination. You should usually select Resource specific since the table structure allows for more flexibility and more efficient queries.

Select Save.

After a few moments, the new setting appears in your list of settings for this resource. Logs are streamed to the specified destinations as new event data is generated. It might take up to 15 minutes between when an event is emitted and when it appears in a Log Analytics workspace.
Troubleshooting
Metric category isn't supported
When deploying a diagnostic setting, you receive an error message, similar to Metric category 'xxxx' is not supported. You may receive this error even though your previous deployment succeeded.
The problem occurs when using a Resource Manager template, REST API, Azure CLI, or Azure PowerShell. Diagnostic settings created via the Azure portal aren't affected as only the supported category names are presented.
Metric categories other than AllMetrics aren't supported except for a limited number of Azure services. Previously other category names were ignored when deploying a diagnostic setting, redirecting them to AllMetrics. As of February 2021, the metric category provided is validated. This change caused some deployments to fail.
To fix this issue, update your deployments to remove any metric category names other than AllMetrics. If the deployment adds multiple categories, use only one AllMetrics category. If you continue to have the problem, contact Azure support through the Azure portal.
Setting disappears due to non-ASCII characters in resourceID
Diagnostic settings don't support resourceIDs with non-ASCII characters (for example, Preproduccón). Since you can't rename resources in Azure, you must create a new resource without the non-ASCII characters. If the characters are in a resource group, you can move the resources to a new group.
Possibility of duplicated or dropped data
Every effort is made to ensure all log data is sent correctly to your destinations, however it's not possible to guarantee 100% data transfer of logs between endpoints. Retries and other mechanisms are in place to work around these issues and attempt to ensure log data arrives at the endpoint.
Inactive resources
When a resource is inactive and exporting zero-value metrics, the diagnostic settings export mechanism backs off incrementally to avoid unnecessary costs of exporting and storing zero values. The back-off may lead to a delay in the export of the next non-zero value.
When a resource is inactive for one hour, the export mechanism backs off to 15 minutes. This means that there is a potential latency of up to 15 minutes for the next nonzero value to be exported. The maximum backoff time of two hours is reached after seven days of inactivity. Once the resource starts exporting nonzero values, the export mechanism reverts to the original export latency of three minutes.
This behavior only applies to exported metrics and doesn't affect metrics-based alerts or autoscale.