Collect data by using the Azure Monitor Agent
The Azure Monitor Agent collects data from Azure virtual machines, virtual machine scale sets, and Azure Arc-enabled servers. Data collection rules (DCRs) define the data to collect from the agent and where to send the data. This article describes how to use the Azure portal to create a DCR to collect different types of data and to install the agent on any machines that require it.
If you're new to Azure Monitor or have basic data collection requirements, you might be able to meet all your requirements by using the Azure portal and the guidance in this article. If you want to take advantage of more DCR features, like transformations, you might need to create a DCR by using other methods or edit a DCR after you create it in the portal. You can use different methods to manage DCRs and create associations if you want to deploy by using the Azure CLI, Azure PowerShell, an Azure Resource Manager template (ARM template), or Azure Policy.
Note
To send data across tenants, you must first enable Azure Lighthouse.
Warning
The following scenarios might collect duplicate data, which can increase billing charges:
- Creating multiple DCRs that have the same data source and associating them to the same agent. Ensure that you filter data in the DCRs so that each DCR collects unique data.
- Creating a DCR that collects security logs and enabling Microsoft Sentinel for the same agents. In this case, you can collect the same events in the Event table and in the SecurityEvent table.
- Using both the Azure Monitor Agent and the legacy Log Analytics agent on the same machine. Limit duplicate events to only the time when you transition from one agent to the other.
Data sources
The following table lists the types of data you can currently collect by using the Azure Monitor Agent and where you can send that data. The link for each data source is for an article that describes the details of how to configure the data source. Complete the steps in this article to create the DCR and assign it to resources, and then see the relevant linked article to learn how to configure the data source.
| Data source | Description | Client OS | Destinations |
|---|---|---|---|
| Windows events | Information sent to the Windows event logging system, including sysmon events | Windows | Log Analytics workspace |
| Performance counters | Numerical values that measure the performance of different aspects of the operating system and workloads | Windows Linux |
Azure Monitor metrics (preview) Log Analytics workspace |
| Syslog | Information sent to the Linux event logging system | Linux | Log Analytics workspace |
| Text log | Information sent to a text log file on a local disk | Windows Linux |
Log Analytics workspace |
| JSON log | Information sent to a JSON log file on a local disk | Windows Linux |
Log Analytics workspace |
| IIS logs | Internet Information Service (IIS) logs from the local disk of Windows machines | Windows | Log Analytics workspace |
Note
The Azure Monitor Agent also supports the Azure service SQL Best Practices Assessment, which is currently in general availability. For more information, see Configure best practices assessment by using the Azure Monitor Agent.
Prerequisites
- Permissions to create DCR objects in the workspace.
- For all prerequisites, see the linked article in the preceding table that describes the relevant data source.
Create a data collection rule
The Azure portal provides a simplified experience for creating a DCR for virtual machines and scale sets. Using this method, you don't need to understand the structure of a DCR unless you want to implement an advanced feature, like a transformation. You can also use other creation methods that are described in Create DCRs in Azure Monitor.
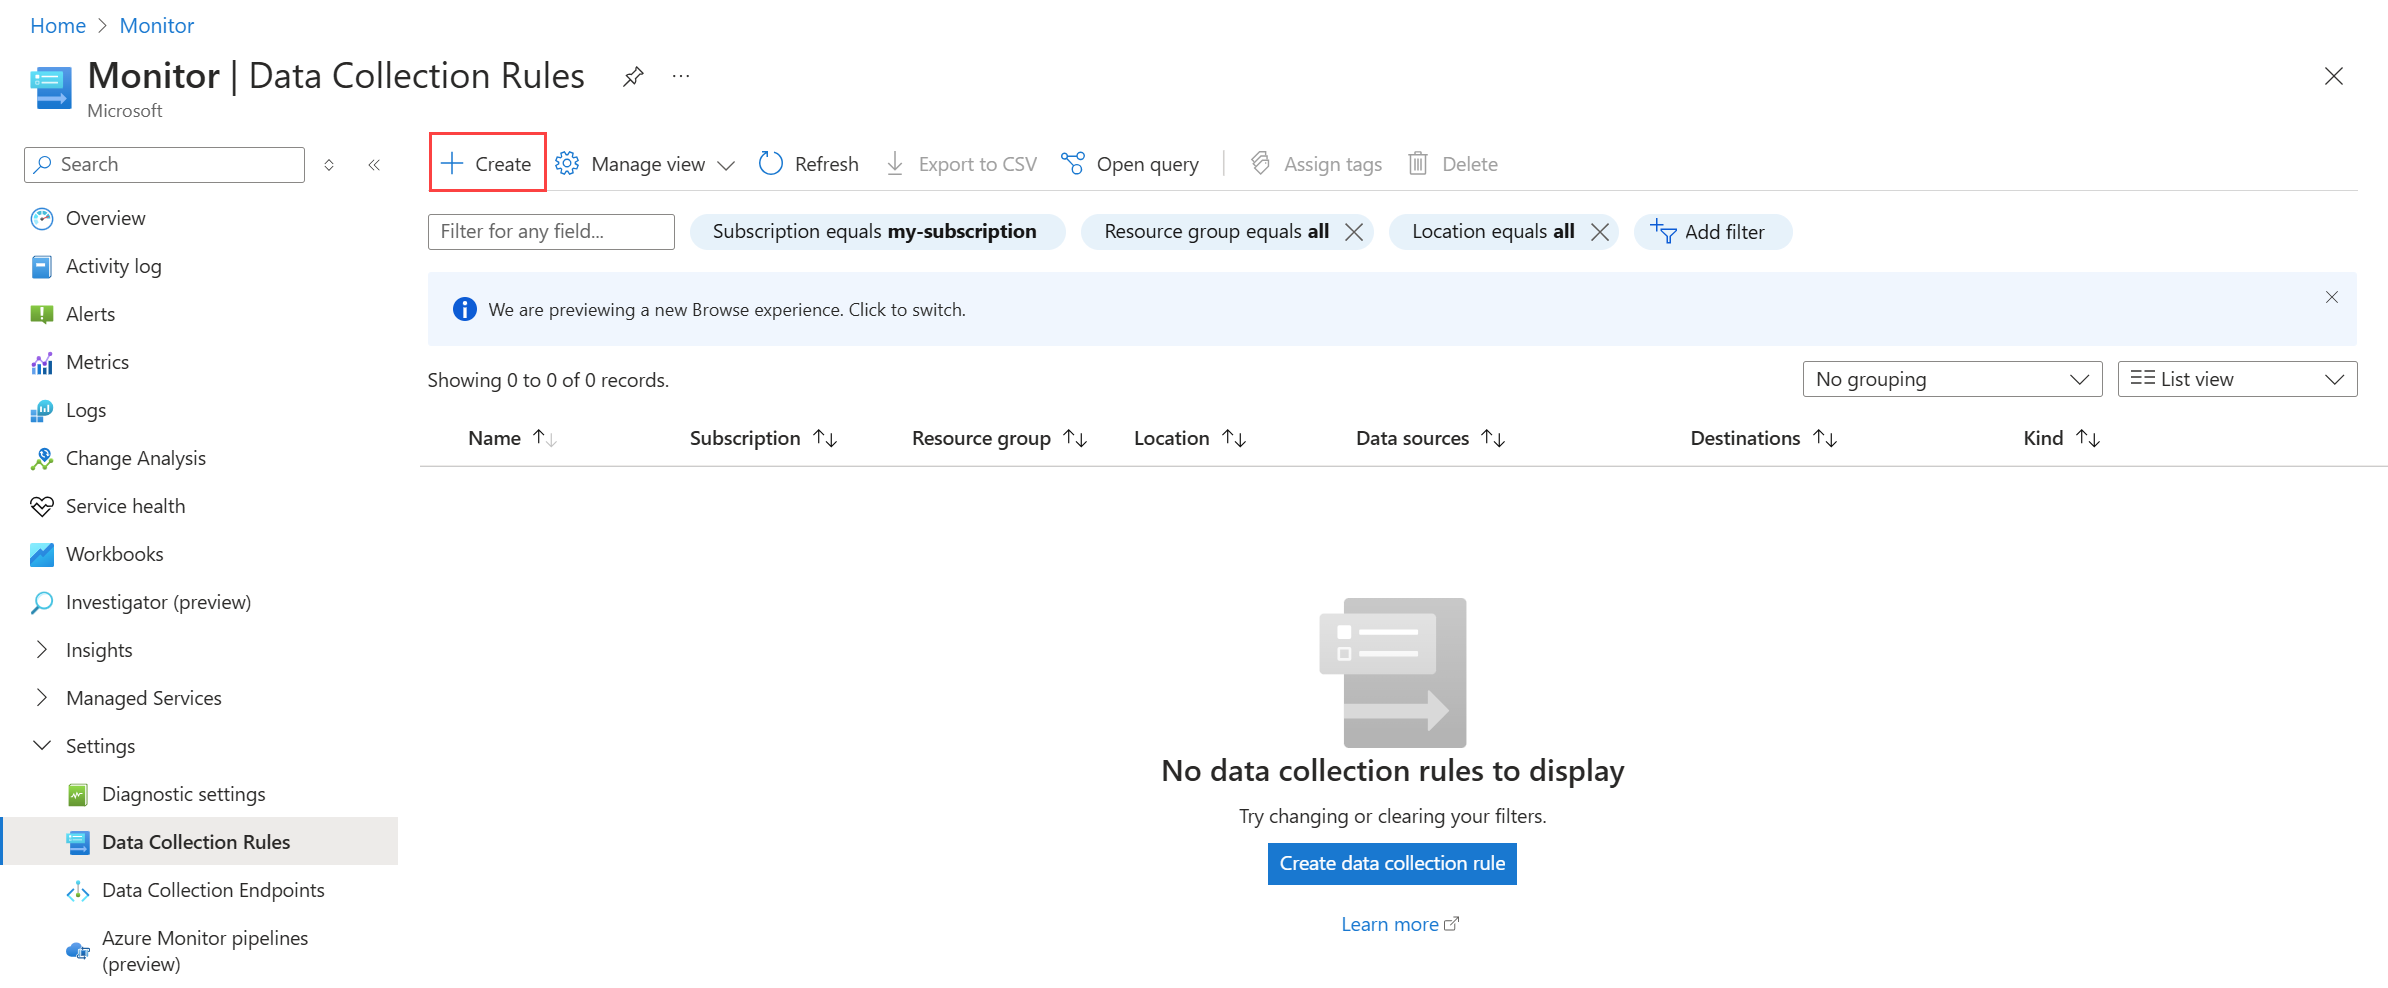
In the Azure portal, on the Monitor menu, select Data Collection Rules > Create to open the DCR creation pane.
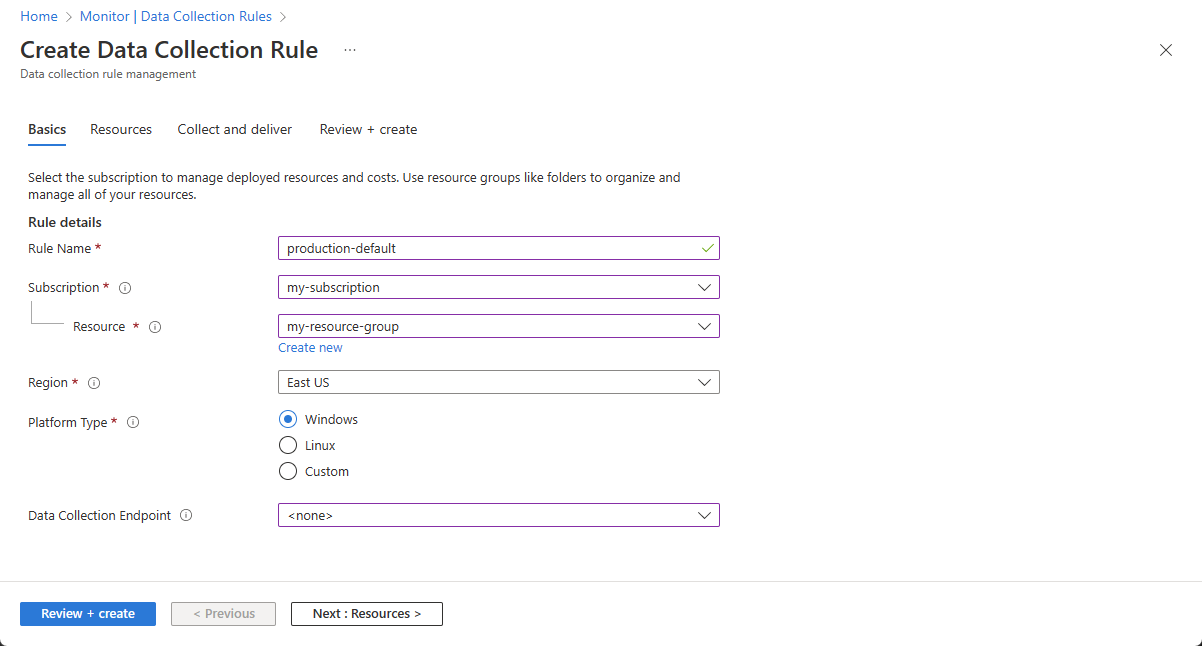
The Basics tab includes basic information about the DCR.
| Setting | Description |
|---|---|
| Rule Name | A name for the DCR. The name should be something descriptive that helps you identify the rule. |
| Subscription | The subscription to store the DCR. The subscription doesn't need to be the same subscription as the virtual machines. |
| Resource | A resource group to store the DCR. The resource group doesn't need to be the same resource group as the virtual machines. |
| Region | The Azure region to store the DCR. The region must be the same region as any Log Analytics workspace or Azure Monitor workspace that's used in a destination of the DCR. If you have workspaces in different regions, create multiple DCRs to associate with the same set of machines. |
| Platform Type | Specifies the type of data sources that are available for the DCR, either Windows or Linux. None allows for both. 1 |
| Data Collection Endpoint | Specifies the data collection endpoint (DCE) that's used to collect data. The DCE is required only if you're using a data source that requires a DCE. For more information, see Set up data collection endpoints based on your deployment. |
1 This option sets the kind attribute in the DCR. You can set other values for this attribute, but the values aren't available to select in the portal.
Add resources
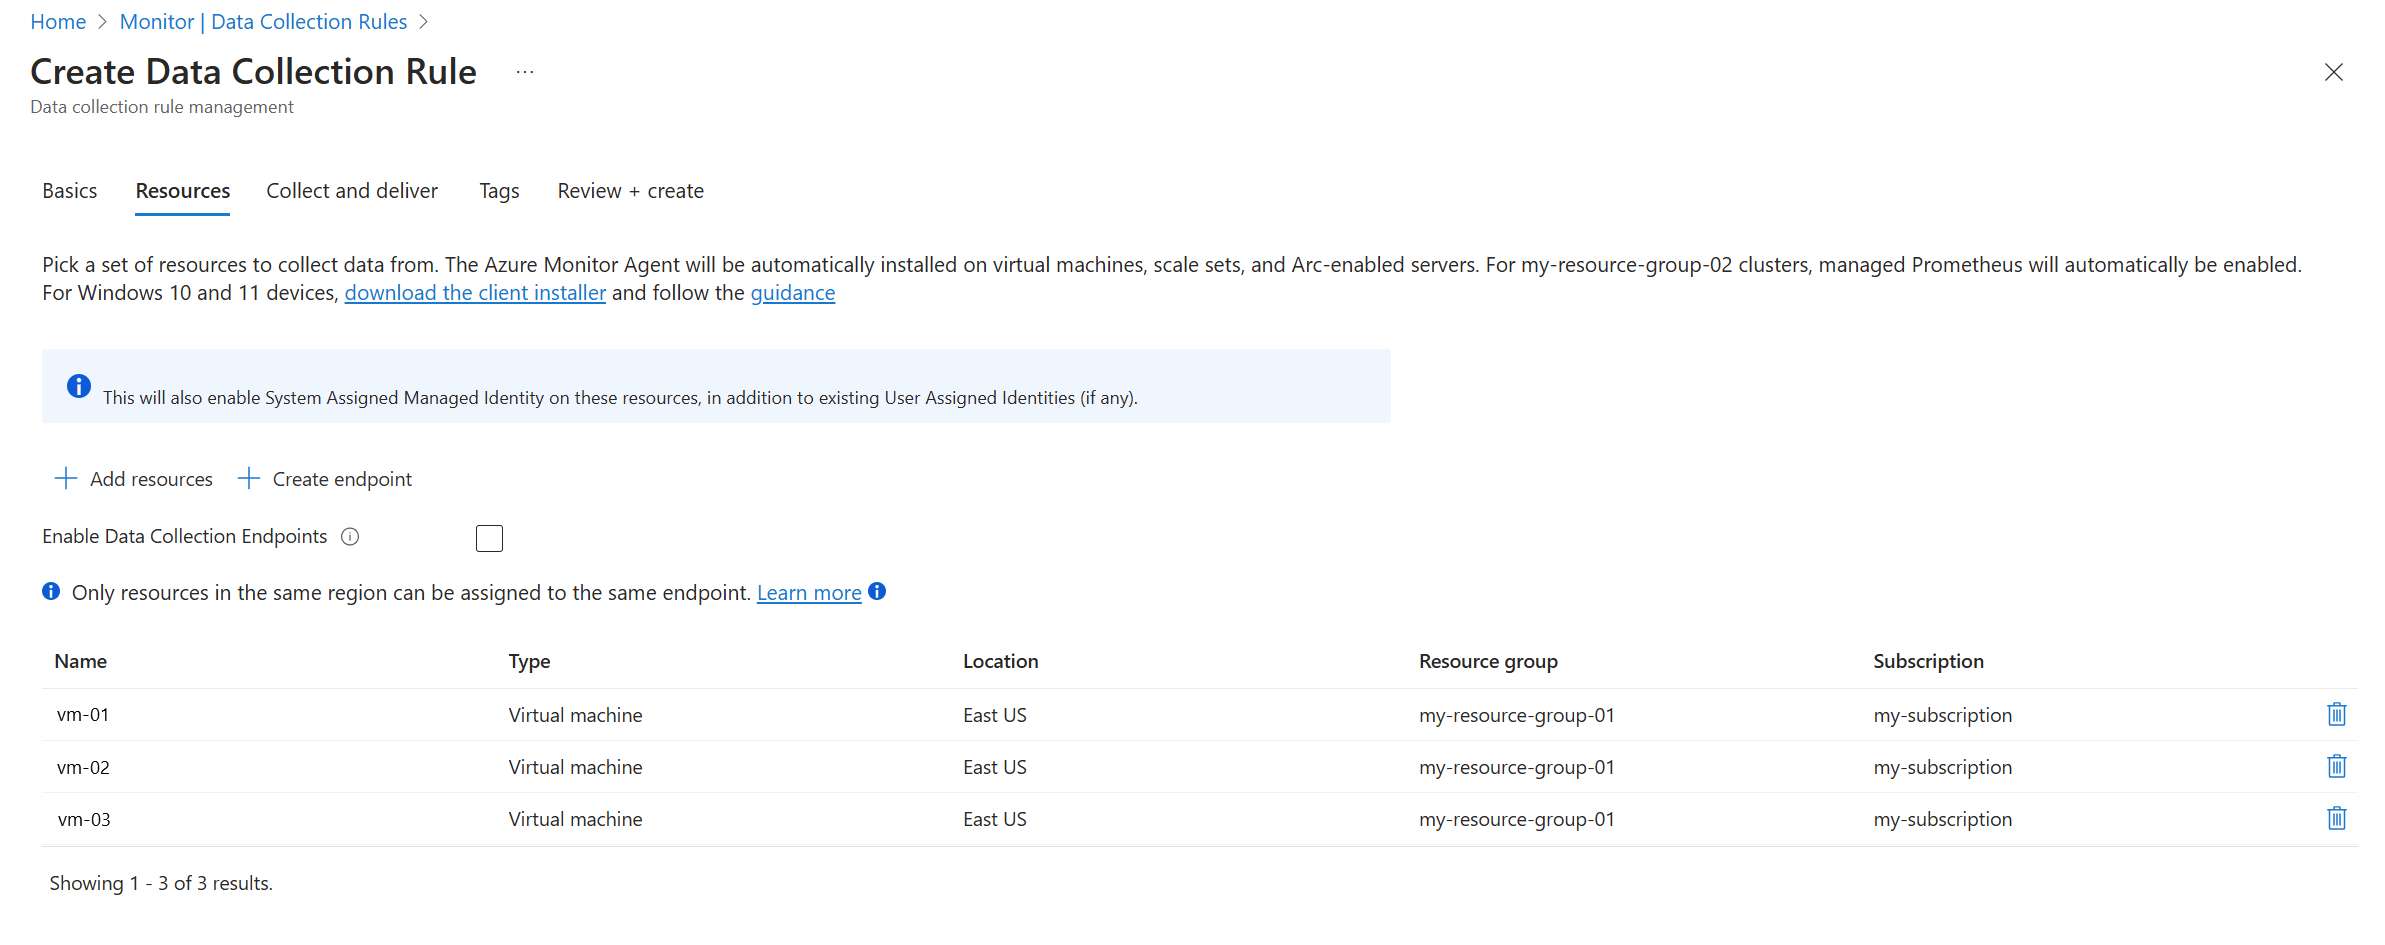
On the Resources pane, you can add VMs to be associated with the DCR. To choose resources to add, select Add resources. The Azure Monitor Agent is automatically installed on any resource that doesn't already have the agent installed. A data collection rule association (DCRA) is created between the machine and the DCR.
Tip
Before you add a VM to a DCR, ensure that the VM isn't associated with other DCRs using the same data sources or you may collect duplicate data. See Manage data collection rule associations in Azure Monitor to list the DCRs associated with a VM in the Azure portal. You can also use the following PowerShell command to list all DCRs for a VM:
Get-AzDataCollectionRuleAssociation -resourceUri <vm-resource-id>
If you're using Azure Monitor Private Links, select Enable Data Collection Endpoints on the Resources tab and select an endpoint in the region of each monitored machine.
Important
When resources are added to a DCR, the default option in the Azure portal is to enable a system-assigned managed identity for the resources. For existing applications, if a user-assigned managed identity is already set, if you don't specify the user-assigned identity when you add the resource to a DCR by using the portal, the machine defaults to using a system-assigned identity that's applied by the DCR.
Add data sources
On the Collect and deliver pane, you can add and configure data sources for the DCR, and add a destination for each source.
| Setting | Description |
|---|---|
| Data source | Select a Data source type and define related fields based on the data source type you select. For details about configuring each type of data source, see related articles in Data sources. |
| Destination | Add one or more destinations for each data source. You can select multiple destinations of the same type or select different types. For example, you can select multiple Log Analytics workspaces, which is called multihoming. See the details for each data type for the different destinations they support. |
A DCR can contain multiple different data sources. A maximum of 10 data sources can be in a single DCR. You can combine different data sources in the same DCR, but you typically create different DCRs for different data collection scenarios. For recommendations on how to organize your DCR, see Best practices for data collection rule creation and management in Azure Monitor.
Note
It can take up to 5 minutes for data to be sent to the destinations when you create a DCR by using the data collection rule wizard.
Verify operation
After you create a DCR and associate it with a machine, you can verify that the agent is operational and that data is being collected by running queries in the Log Analytics workspace.
Verify agent operation
Verify that the agent is operational and communicating properly by running the following query in Log Analytics. The query checks to see if there are any records in the Heartbeat table. A record should be sent to this table from each agent every minute.
Heartbeat
| where TimeGenerated > ago(24h)
| where Computer has "<computer name>"
| project TimeGenerated, Category, Version
| order by TimeGenerated desc
Verify that records are received
It takes a few minutes for the agent to be installed and start running any new or modified DCRs. You can then verify that records are being received from each of your data sources by checking the table that each source writes to in the Log Analytics workspace.
For example, the following query checks for Windows events in the Event table:
Event
| where TimeGenerated > ago(48h)
| order by TimeGenerated desc
Troubleshoot
If data that you're expecting to see isn't collected, complete the following steps:
Verify that the agent is installed and running on the machine.
See the troubleshooting section of the article for the data source you're having trouble with.
Enable monitoring for the DCR, and then:
- View metrics to determine if data is being collected and whether any rows are being dropped.
- View logs to identify errors in the data collection.
Related content
- Collect text logs by using the Azure Monitor Agent.
- Learn more about the Azure Monitor Agent.
- Learn more about data collection rules.


