Announcing the redesigned F12 developer tools interface
With two major updates over the spring and summer, we have continued to improve the developer experiences available in IE's F12 developer tools and today we are excited to provide details around our latest update.
This update addresses concerns that many users had with the vertical navigation model we introduced in IE11, and provides a more traditional horizontal model.
Changes to the F12 user interface
Overall design
When we introduced the vertical navigation model, our goal was to optimize for vertical real estate. Your feedback validated that we successfully achieved that goal. However, it also became clear that using a vertical navigation model with icons identifying complex tools, lead to hesitation and confusion for novice and expert users alike.
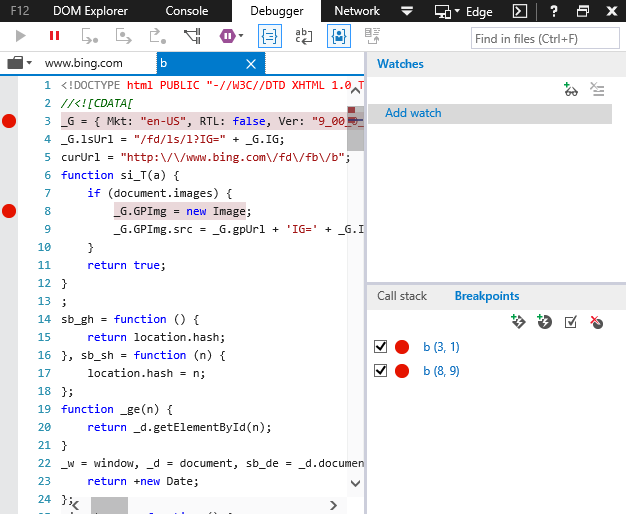
In order to address those issues, we implemented a more traditional navigation interface that sits horizontally at the top of the tools. As part of this change, the tool icons were removed and replaced with the tool’s name. We retained the tool notification badges—like the debugger pause icon or the console error count—and removed tool names from their respective toolbars to make more space available to the tools themselves.

Overflow experience
When the tools window isn't wide enough to fit all of the tool names, a drop-down menu provides access to the tool names that didn't fit and provides the same notification badges available in the full-width version of the tools.
Undocked experience
When the tools are undocked, they retain the same experience and functionality of the current tools. In this design, the window “grab area” is in document title region along the top and the window resize area sits along the sides of the tools.

We are grateful for all the feedback you have provided to date, and we want to encourage you to continue to provide suggestions as you find issues, bugs, or experiences you believe could be improved in order to make your daily development activities easier and more impactful.
Try this new change and let us know your thoughts. Leave a comment below, reach out on Twitter, or visit our new User Voice site to share your feedback.
— Ruben Rios, Program Manager, Internet Explorer
Comments
Anonymous
December 09, 2014
Very nice update. Finaly kills the annoying scrolling issue. Thanks.Anonymous
December 09, 2014
Thanks, even after using F12 tools regularly the icons in the vertical tool bar were hard to distinguish and their functions were not obvious.Anonymous
December 09, 2014
"Try this new change and let us know your thoughts." Am I missing something? How do I try these changes (or, where / how do I get this update installed on my machine)?Anonymous
December 09, 2014
Now if we could have a dark theme, that'd be amazing :)Anonymous
December 09, 2014
Great! Appears like there is more real estate now!!Anonymous
December 09, 2014
I think you might rearrange tab order so 2 most important and useful tabs would be first and last. My personal favorites - DOM explorer (should be first) and Console (should be last)
- DOM Explorer is by far the most frequent tab
- Switching to Console is the operation you use when you need an instant sneak peek. Other tabs can wait an extra second when you search for them ;)
Anonymous
December 09, 2014
@Brendan, the changes are part of the updates that were rolled out today for IE11. Make sure you install all Windows updates and you should be able to see the changes.Anonymous
December 09, 2014
Brendan, These updates are available via Windows Update.Anonymous
December 09, 2014
Is the update automatic? or do we need to download something? I'm still stuck with the horrible vertical menu! Please DO NOT TIE this to Windows Update as that is often locked down at an IT level but the browser/tools are not. The Dev Tools should always be upgradable by the user at ANY time without WU restrictions!Anonymous
December 09, 2014
Great! Now just get rid of the absurd singleline/multiline edit mode that is a hold-over from Firebug. All edits should be "multiline" mode- like almost every other REPL in existence.Anonymous
December 09, 2014
Awesome! Much nicer and clearer IMO.Anonymous
December 09, 2014
The comment has been removedAnonymous
December 09, 2014
It seems the tools are still missing what was part of them before IE11: all those settings that you could do from the various menus. Set default View Source editor. Delete Cache, Cookies etc. only for this page or this domain. Toggle Javascript, CSS etc. on/off. All these valuable options still gone. Users keep asking me in the forums how they can do it now easily. Please reintroduce them.Anonymous
December 09, 2014
We really need an option for HEX or RGB instead of RGBA when the colour doesn't use alpha channel.Anonymous
December 09, 2014
Really! it's good......Anonymous
December 09, 2014
Thanks.Anonymous
December 09, 2014
Nice work F12 team.Anonymous
December 09, 2014
Cool. I just learned what icon is what and they are removed :)Anonymous
December 09, 2014
still missing Sources tab like the one in Chrome.Anonymous
December 09, 2014
This is fantastic and very much appreciated!Anonymous
December 10, 2014
VAI KADA NEVELAS IZGERPTIES SKAIPAA UN PAVELET MAN AR SO TO/?Anonymous
December 10, 2014
This is definitely appreciable. It will add more value to the tool if you have "Sources" tab.Anonymous
December 10, 2014
Well... it seems I cannot scroll anymore, this time horizontally. Do I have to click the arrow and select the wanted item? I don't think clicking an arrow button is better than scrolling...Anonymous
December 10, 2014
@Dale: unfortunately the dev tools is part of the browser itself and can't be updated separately.Anonymous
December 11, 2014
Still no fix for the empty emulation drop-down lists problem which was closed as "fixed" in July. connect.microsoft.com/.../ie11-emulation-screen-document-mode-and-user-agent-dropdowns-blank-for-all-sitesAnonymous
December 11, 2014
Looks great guys very nice. Can't wait to try it out!Anonymous
December 11, 2014
Can this updated f12 tool be installed as a standalone for IE8/or upgrade existing f12 devtool(in IE8)?Anonymous
December 11, 2014
is this update available for IE11 on Windows 10?Anonymous
December 11, 2014
@Bucha - Nop. Saddly. When it comes to features, the IE11 in Windows 10 stands at the same level as version 11.0.8 for Windows 8.1 from May earlier this year. There isn't a search bar on the new tab page either, etc. They probably fix that with the next build on September 21th, when we hopefully get to see IE12.Anonymous
December 11, 2014
Unfortunately, I can't use the new debugger at all. No files found by the debugger tab, and the DOM explorer tab shows a stacktrace from an exception: "Exception in window.onload: Error: An error has occurred JSPlugin.3005" Seems to be a JS function being called in F12Resources.dll/23/pluginhost/plugin.f12.js Of the tabs available, the only ones that work are the Network and Profiler tabs.Anonymous
December 11, 2014
css sources are still not availableAnonymous
December 11, 2014
The comment has been removedAnonymous
December 12, 2014
What's the KB # for this update?Anonymous
December 12, 2014
I second hchan's report... see this forum post for others' report... answers.microsoft.com/.../09b4f305-e436-4615-a8a5-705b0bc85bbd HELP! :-)Anonymous
December 12, 2014
It'll be a comment unrelated to an article, but please stop to teach some bugs and defects by an update every month. Very perplexed. Is it inspected with a test accurately for your production?Anonymous
December 13, 2014
Can you update the images on modern.ie with these changes?Anonymous
December 13, 2014
@Feng, @K Mishra - Chrome's Sources is IE's Debugger, they have screen shots in this article if you are still confused.Anonymous
December 13, 2014
@Chris Love - It is not the equivalent... you cannot live edit scripts, for example. The hierarchy is practically non existent. I do not think CSS shows up there, too. I think it is kind of like the equivalent of the "Scripts" panel that shipped with Chrome 1 - 4 (approximately), though.Anonymous
December 13, 2014
The comment has been removedAnonymous
December 13, 2014
The comment has been removedAnonymous
December 13, 2014
The comment has been removedAnonymous
December 13, 2014
@Yannick -
- I came to realize that Chrome is not the only browser that does not fully implement features or standards, Internet Explorer does it too (and of course, the rest). Different features get different levels of implementations. Every browser does that. The rest of your comment really deals with semantics (Opera is Chromium based, Opera does not have its own developer tools, HTML5.1 instead of HTML6 and so on). Semantics do not justify stuff.
Anonymous
December 14, 2014
The comment has been removedAnonymous
December 14, 2014
The text menus are much better, the overflow secondary menus are great and the fact that they were pushed out to current existing versions (at least here on Windows 7 with IE11) are three simultaneous wins. Debugging with IE 11 was a burden, now I can simply concentrate on being productive: thank you!Anonymous
December 14, 2014
@Jason - You are referring to main areas in general, but Yannick asked for specific features, really. "The DOM Explorer is not good enough" is not a good enough comment, what should be improved? What is missing? What is buggy? You cannot say that everything is buggy, because some stuff does work. You can use UserVoice for features you are missing and Connect (yeah, I know) for bugs.Anonymous
December 14, 2014
I blogged about killing developer channel IE for windows 7 here geekswithblogs.net/.../internet-explorer-developer-channel-is-discontinued-for-win7.aspxAnonymous
December 16, 2014
Definitely the better with the tab names, instead of having to guess which tab is which. The following features would help:
- In the debugger, having the console window. Or the ability to pull the console window from the bottom in any tab.
- Easier to discover settings like disable cache, etc.
- Button to enable automatic network logging.
Anonymous
December 17, 2014
Update to the issue I was having before, I ran a round of windows updates and found IE-related updates KB3008923 and KB2976627. Installed both and now have a working debugger in IE11. I'm not sure which one fixed it.Anonymous
December 18, 2014
I love the new Developer toolbar. The horizontal view is so much easier and even quicker to work in (not having to think what the icons might mean). Great job!Anonymous
December 20, 2014
Why does this changes are not currently present in Windows 10 build 9879?Anonymous
March 22, 2015
Can you get yahoo to change my phone number to 601-408-5460 ? My old number was 601-408-5559 my email is b31curtis@yahoo.com