Announcing new F12 dev tools features in August update
Today we’re excited to share all the F12 features that shipped in the August update to IE11!
In April, we shipped a swath of new features of F12 Developer Tools in Internet Explorer 11 focusing on providing accurate data in the DOM Explorer, actionable data in the memory and performance tools and a smoother debugging experience with Just My Code.
With the IE Developer Channel in June we previewed more features in the F12 Developer Tools and now all of these features are shipping out to all of our customers. It’s a long list which you’ll find below or on MSDN but the highlights are:
- Import and export sessions in the Memory and UI Responsiveness tools
- Improved filtering capabilities in the Memory and UI Responsiveness tools
- A color picker in the DOM Explorer that allows you to pick colors from any window on your desktop.
With this update to IE11 and F12, we’re keeping the pace of updating the F12 developer tools more often, getting you the latest features and bug fixes as soon as we can. Expect to see and hear from us more and if you’d like to provide feedback, or ask for new features and help simply reach out on Twitter @IEDevChat, or on Connect.
— Andy Sterland, Senior Program Manager, Internet Explorer
Changes to the F12 user interface
New icons and notifications
The icons for the Memory and Profiler tools have changed.
There are now indicators on the icon bar for errors in the Console, changes in Emulation settings, and for active profiling sessions in the Memory, Profiler, and UI Responsiveness tools. The image below shows the new icons with notifications on the Console and Memory tool icons, indicating there are two Console errors displaying and that a Memory profiling session is currently in progress.

F6 superset navigation within tools
Using F6 is like using the tab key to navigate around a tool, but it "tabs" through a selected set of the most commonly used elements in a tool pane, rather than through every selectable item. This is part of an overall cleaner system for using the keyboard to navigate within and between tools.
Move back and forth between recently used tools using the keyboard
Use CTRL + [ to move backwards in your tool navigation history, CTRL + ] to go forward, much like the back and forward arrows when you're browsing.
Quick access to document mode
Want to access the Document mode without switching tools? We added a new dropdown at the top that gives you access to the document mode from any tool.

Console changes
console.timeStamp()
When called from the Console or within code, it outputs to the Console the number of milliseconds the current browser tab has been open. If called while running a profiling session with the UI Responsiveness tool, it creates a user mark on the session's timeline with a timestamp based on the time since the session started.
CTRL+L clears the console of all messages
Accurate autocomplete
Console's autocomplete no longer includes indexer properties, making for a cleaner and more accurate selection of autocomplete suggestions.
$, $$, $x, $0-$5, and $_ have been added to the Console autocomplete list for the convenience for those who use them and to make the Console's behavior more consistent with other browsers.
Stale message indicator
If you have chosen to turn off the Clear on navigate option, older console messages have their icons greyed out to help distinguish between messages for the active page and messages from prior pages in your history.
DOM Explorer changes
Change bars in Computed pane
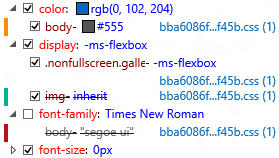
The change bars (different colors for changed properties, added properties, and deleted properties) users have been enjoying the Styles pane, now appear in the Computed styles pane.
Color Picker
Clicking on the color picker icon (or by using the keyboard shortcut ctrl+k) will open up a free standing version of the color picker with the expanded color wheel that’s useful for getting colors that are then going to be pasted elsewhere either in F12 or back in a text or image editor.

Color Wheel
The color wheel is the 2nd icon on the color picker and when activated will expand to show the color wheel. The actual color wheel is a set of four sliders (as below) which can be used to change the HSL and transparency values for a color.

Color Swatch
The swatch on the color picker is a palette of all the colors F12 found in the CSS files associated with the page sorted by the number of occurrences. This should make finding common colors, such as accent colors, much easier. The swatch can be navigated with the left and right arrow keys which will scroll through all the colors.
Color Square
Clicking on a color square brings up the color picker with the color wheel collapsed and can be used to set the color for the particular CSS property.
Eye Dropper
The eye dropper can be used to pick a color under the cursor from any screen on the computer which is great for getting values from image editors or from other Web pages. There’s a limitation in the eye dropper where the color will be off by 1/255 of its real value. We’ll fix this in a future update.
Debugger changes
Sourcemaps designate
Right-click on a document's tab in the Debugger and you can specify a source map. This makes it possible to use source maps with shipped code that has had the source map comment removed.

Autocomplete in watches
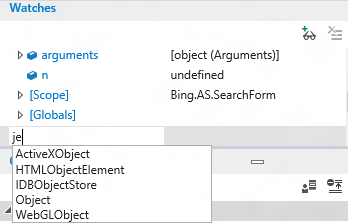
Now, when adding a watch, you get autocomplete options suggested.
Return value inspection
When breaking on a function with a return value, step into the function until you've stepped to the closing curly bracket. The return value will be displayed in the Locals portion of the Watches pane. Step again and the value will be returned to the code that called for it.
For a quick demonstration, try this code in the Console:
function showval() { var x = 0; x++; debugger; return x; } showval();It will call the function, break on debugger, and you can step into it to see the return value.
Multi-select for breakpoints
CTRL + CLICK, SHIFT + CLICK, and CTRL + A work to select multiple breakpoints in the Breakpoints pane.
Continue and ignore breaks
Press F5 to continue to the next break. Hold F5 to continue past multiple breaks until you release F5.
Event breakpoints and tracepoints
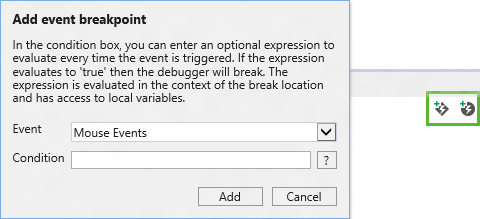
These work much like the breakpoints and tracepoints already present in F12 tools, but instead of being triggered when a specific block of code is executed, they are triggered when a specific event fires. Each has an optional conditional filter to help you narrow down their scope to the specific instance of an event that you want to inspect. They can be added using the Add event tracepoint and Add event breakpoint icons highlighted in the image below.
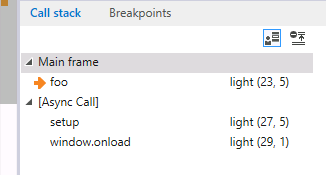
Async call stack code
You can now see the call stack for those pesky async calls!
UI Responsiveness tool changes
Import/export performance sessions
You shouldn't have to reproduce your test case every time you want to analyze data it produces or share that data with a colleague. The import (folder) and export (disk) icons on the UI Responsiveness tool's icon bar let you save your memory snapshots to a file that can be imported later.
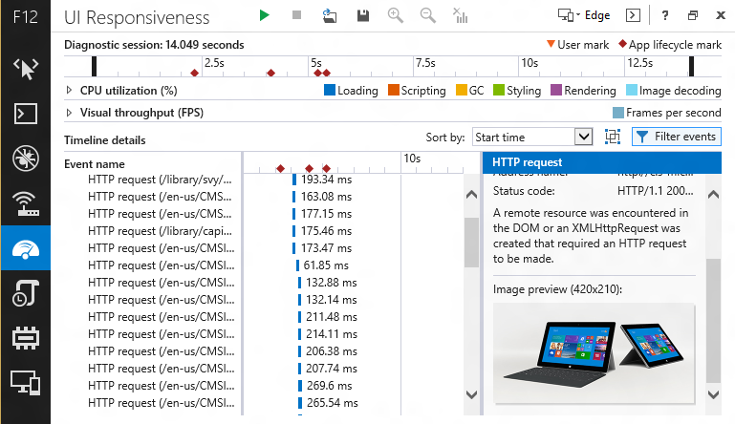
Image preview
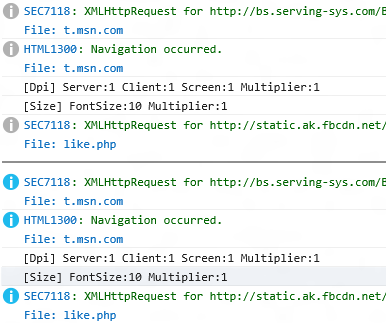
If you've seen an HTTP request for an image and wondered which image it was, the image is now previewed in the event details.
Filtering events
The Filter events button is small but mighty. Hidden behind that button is a menu that lets you filter events in multiple ways and each way has a significant impact.
Event name filter
Filter for any event name containing a match for the filter text.
UI activity filter
Using the checkboxes, you can exclude larger categories of events to make it easier to focus on the area you're investigating. For example, if you're just interested in network activity, you can filter out all the noise of the UI and garbage collection.
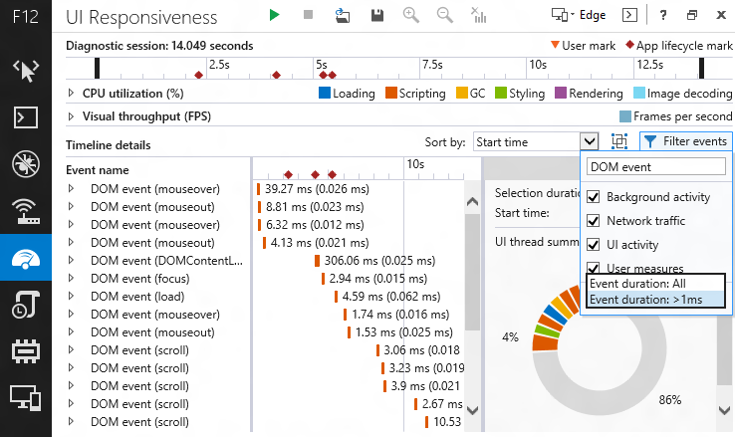
Time threshold filter
This feature filters out top-level events less than 1ms in duration. In many scenarios, this dramatically simplifies the waterfall view and helps you focus on more impactful events.
HTML5 scripting events
If you use media query listeners or MutationObservers, you can now identify their respective costs when running a performance profiling session.

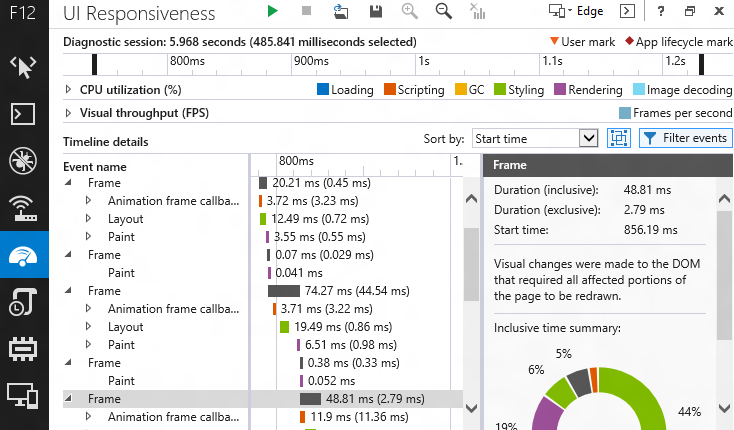
Frame grouping
The button between the Sort by dropdown and the Filter events menu toggles Frame grouping. This groups top-level events into their corresponding unit of work (or "frame") during periods of time where animations/visual updates were occurring. The frames are treated like other events, so they can be sorted and filtered, and they provide an Inclusive time summary.
User measures
If you use the performance.mark() API to add triangles to the timeline, indicating where specific events happened, the performance.measure() API extends the usefulness of performance marks. Use the performance.measure() to create a User measure event encompassing the time between two performance.mark() events, right click the event, and use the Filter to event option to select just the events between the two marks.

Colorization for DOM
This feature adds colorization to DOM elements, string literals and number literals. Besides making the content within the different F12 tools look and behave more alike, it adds a little more visual interest to the UI Responsiveness tool.
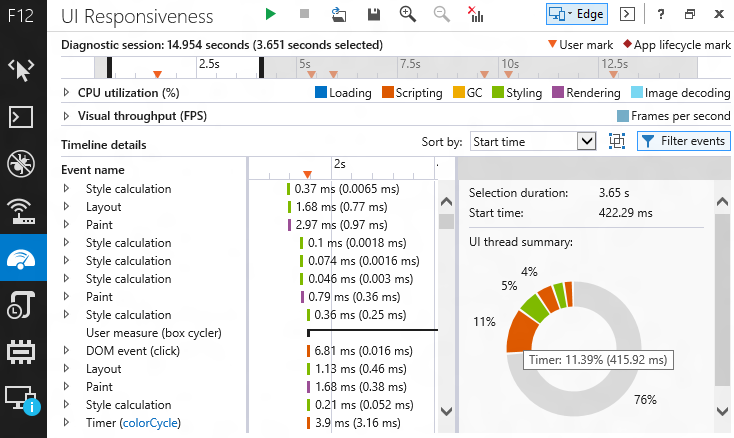
Selection summary
When you select a portion of the timeline, the event details pane will show a summary of the selection. Hover over different segments of the circular chart for a tooltip with the segment's event category.
Support for console.timeStamp()
Using the console.timeStamp() method in your code or in the console during a profiling session creates a user mark on the timeline with the time since the profiling session began.
Memory tool changes
Dominator folding
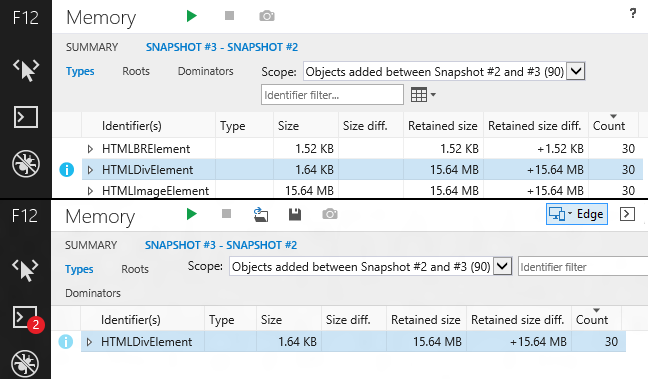
Dominator folding helps simplify the contents of a snapshot by removing objects from the top-level views that are logically components of another object (e.g. a <BR> within a <DIV>, a Scope held on to by a Function) and tend to be extra details that don’t improve your insight into the data, but could waste your time.
For example, the image below shows before and after views, demonstrating how dominator folding improves the "story" the tool is telling. The folded view shows 30 HTML <DIV> elements, which account for 15.64 MB of memory, and are holding on to detached DOM nodes. In many cases, it isn’t important to know the composition of an object, so much as simply knowing that it is too large, or that it is leaking (especially when using third-party libraries).
Colorization of DOM, String & Number literals
This feature adds colorization to DOM elements, string literals, and number literals. Besides making the content within the different F12 tools look and behave more alike, it makes memory analysis a little more visually interesting.
Roots cycle filtering
Want to be able to investigate the composition of an object without getting unknowingly lost in a circular reference path? This feature detects child references which are circular and “trims” them, so that you don’t get confused by traversing them into infinity. Additionally, it annotates these references so that it’s clear when a reference has in fact been "trimmed."
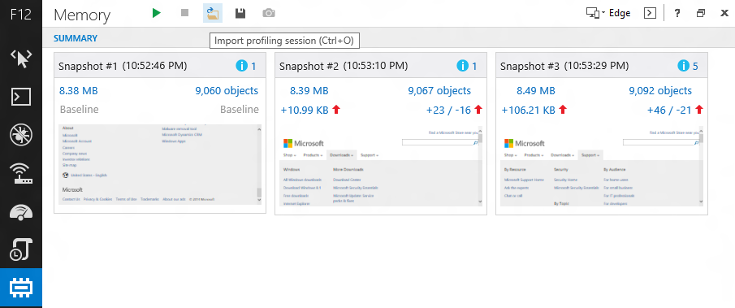
Import/export session
You shouldn't have to reproduce your test case every time you want to analyze data it produces or share that data with a colleague. The import (folder) and export (disk) icons on the Memory tool's icon bar let you save your memory snapshots to a file that can be imported later.
Emulation tool changes
Settings persistence and reset
A Persist Emulation settings icon is added to the Emulation tool. This will maintain your current emulation settings until specifically disabled, allowing you to work, close the browser, and come back with your emulation settings intact. To its right is a Reset Emulation settings icon, which quickly resets the tool back to default values.

Comments
Anonymous
August 14, 2014
Nice to see the tools improving. However, there are still serious problems: Since installing the latest update, I've had to disable EMET 5.0's EAF+ check for IE to get the developer tools to open without crashing. Also, the emulation drop-down lists are blank unless IE is elevated: connect.microsoft.com/.../ie11-emulation-screen-document-mode-and-user-agent-dropdowns-blank-for-all-sites Windows 8.1 (6.3 build 9600) IE 11.0.9600.17239 (Update versions 11.0.11) EMET 5.0.5324.31804Anonymous
August 14, 2014
Just wondering on the use of mystery meat navigation for the main icons. (en.wikipedia.org/.../Mystery_meat_navigation) I've always considered that an anti-pattern. Why make users think more to know where they want to go? Please put labels on the icons that say what they actually are.Anonymous
August 14, 2014
The comment has been removedAnonymous
August 14, 2014
@EricLaw: Thanks for the update. Any news on the emulation tools fix?Anonymous
August 14, 2014
The comment has been removedAnonymous
August 14, 2014
Hey guys, I have to say I really appreciate the work you're doing to enhance the way developers use IE. It's really awesome, and something other browsers (ahem - Chrome) should keep in mind. Thanks so much!Anonymous
August 14, 2014
When you're fixing the colour picker bug, any chance of dropping the hex code back in? That was one of my most used of the f12 tools and it's now a pain. I'd also love to see the ruler back, and a custom grid overlay.Anonymous
August 14, 2014
When you're fixing the colour picker bug, any chance of dropping the hex code back in? That was one of my most used of the f12 tools and it's now a pain. I'd also love to see the ruler back, and a custom grid overlay.Anonymous
August 14, 2014
Thank you for the update, really niceAnonymous
August 14, 2014
These new features look awesome! Can't wait to get the update.Anonymous
August 14, 2014
Please fireup color picker when color property is edited in DOM explorer (font tag for instance or inline style) and CSS explorer color, background-color or gradient properties. Also allow us to convert between hex to rgba to hsla etc. within the tool. ThanksAnonymous
August 14, 2014
How can I increase the font size in the development tools? not the HTML font, the dev tools itself, the font is very small :-) Actually the font is the correct size when I was 20 years old, but at 40 I need it a bit bigger, Please make it configurable :-)Anonymous
August 14, 2014
Cool stuff, wait for update...Anonymous
August 14, 2014
Love the Event breakpoints and tracepoints but you should support intellisense there too. Actually everywere you type code you should support it. Awesome improvements.Anonymous
August 15, 2014
Hey, great improvement, specially on UI responsiveness tools. It would be great to see more improvements also on IE Web Test Recorder. I’m starting using that for performance testing and it seems promising, but not a complete tool yet. :)Anonymous
August 15, 2014
cool updates ;)Anonymous
August 15, 2014
great stuff. Async call stack code feature is my favouriteAnonymous
August 15, 2014
I'd be good to have
- a log all files downloaded for a web page to a directory
- a way to export some of the lists, like network timing, to csv
- a way to show the first X scripts run when a web page loads - nice to see when page startup scripts run scripts in other files
Anonymous
August 18, 2014
@Tom Winter, @Yannick - We're looking at alternative designs for the navigation system in F12. It's an area that is overdue for some improvements. @Will - We have an item on the backlog to support other color formats (like hex). We also have an item on our backlog for a ruler tool, but it's further down the backlog. @Fiona - Custom color formats other than RGB is on our radar. @GT - We're working on a feature to add zooming to the tools, no dates to share yet though. @Ricardo - The web test recorder is owned by a team in Visual Studio I'll try to pass on your feedback. @Eon - Thanks for the suggestions we have items for those on our backlog and the last two are in the middle but the first is nearer the end. As there further down on the backlog it's hard to say when we'll get to them but they are on our radar.Anonymous
August 18, 2014
So, I have a pretty reproducible (at least on my systems) that demonstrates the "white tabs"/run-away iexplore.exe process. I went to this site in both IE 11 Desktop, and in Chrome: all-that-is-interesting.com/interesting-quotes I clicked "next" and waited about 5 seconds or so between each click (time to read the quote, more or less). And kept clicking Next. In Chrome, the change to the next image was fast, and the .exe processes in Task Manager never grew outrageously, and it stayed fast through to the end (image 99) In IE11, the process size continually grows, and the time it takes between clicking Next and the image changing gets longer and longer. The process consumes more and more CPU as it gets slower and slower. Eventually the tab just goes white. The process will then crash or just hang chewing up CPU.Anonymous
August 18, 2014
I am puzzled with F12 on IE11 because it no longer allows to toggle Browser Mode (Document Mode is still there). Unless I am blind this option has gone. In our environment we are blocking access to Tools/Compatibility View settings options by default (adding sites only causing confusion due to lack of granularity) and only used F12 for testing in e.g. "IE10 Compat View" mode. When Compat Mode is required for an application we added the full site (more granular) to BrowserEmulationPolicy List via GPO (Use Policy List of IE7 sites)Anonymous
August 19, 2014
Trying to go back and add comments to my feedback on IE in "Connect", I can see my feedback, but every time I click on it, I get this: If you believe you have reached this page in error, click the Help link at the top of the page to report the issue and include this ID in your e-mail: b2e0394b-182d-4775-a3d7-7653f396d203 Clicking the "Help" link yields no indication of where or how I should communicate this information (I have no idea what to click there to actually get me to a spot to paste that info in and send it to anyone)... so I'm pasting it here in the hope SOMEONE see it. Is Connect just broken?Anonymous
August 19, 2014
@Norbert Klein-Ildefeld - You have to go to "Emulation", the last button in the navigation of the F12 Tools.Anonymous
August 19, 2014
@Yannick - thx. Sure, I do know the last button "Emulation" - up to IE10 there were two F12 toggle options in the menu - Browser Mode and Document Mode. Now there is only Document Mode.Anonymous
August 21, 2014
Still no fix for connect.microsoft.com/.../ie11-emulation-screen-document-mode-and-user-agent-dropdowns-blank-for-all-sites IE11 isn't usable in this state.Anonymous
August 21, 2014
The comment has been removedAnonymous
August 23, 2014
Has anyone observed Ctrl+Shift+U shortcut in IE11? Is it new in IE11? It seems like a hidden shortcut. I accidentally pressed it and found that it IS awesome. Shortcuts are most welcome IE team. Please don't remove this one like you guys removed Ctrl+Q (quick tabs!). Thanks. Now if only Microsoft guys realize that pressing back or forward button in browser while holding Ctrl should open the corresponding address in a new tab and ctrl+0 to zoom-to-normal should also work when 0 is pressed on numpad (as opposed to the qwerty keyboard; bring productivity and it will make IE only better. All major browsers known to mankind do that ever since the tab browsing was invented, and IE is yet to fix it: connect.microsoft.com/.../one-missing-and-another-poorly-implemented-shortcut (~3 years old) This is really annoying for people who are power users pertaining to tab-browsing, namely; everyone living in modern age..Anonymous
August 25, 2014
Bring back the text-labels for the menus! I'm always clicking on the wrong menus!