SCOM Performance Model with Configuration Data
Configuration data combines very well with performance data collected by SCOM. The usefulness of a configuration dataset generally comes from the server attributes it contains. I usually refer to this as business information (location, environment, owner, role, etc.), but it may contain technical knowledge as well. A server configuration dataset may be added to the performance model from my previous post (blogs.technet.com/b/drewfs/archive/2014/08/12/scom-performance-data-and-power-view.aspx). The new dataset will have a relationship to the Entity dataset using the FQDN or Hostname field. Then Power View reports can then answer questions like the following:
- Which roles in the production SharePoint environment run low on memory? Which farms and servers within those roles run the lowest?
- What does "DNS\Total Query Received/sec" look like by site and DNS server? How does the data compare to "DNS\Total Response Sent/sec" over the same time period?
One might consider SCOM Groups useful for organizing report information. That works in SSRS reports; however, in Power Pivot and tabular data models, a relationship is a one-to-one or many-to-one lookup. There can't be duplicates in the dataset where one is looking up a value. A server tends to be a member of many SCOM groups. I found it very difficult to use more than one group in a model. Another option within SCOM is the Managed Entity Type or class. The classes don't generally help with business-defined data, though. In any event, a configuration management database (CMDB) in some form will be the source of record. It makes sense to get as close to the source in order to minimize conflicting or outdated information.
I would consider some questions when it comes to configuration data:
- How often does it change?
- Is the change history captured somewhere?
- How are discrepancies (duplicate or missing entries) in the data resolved?
I found it helpful to capture a weekly snapshot of server configurations and store it in a SQL table along with the date of the snapshot as a column. In addition to presenting relevant historical information about servers in a performance report, I could report on things like the growth of the environment, the rate of OS deployments or decommissions, and the ratio of physical to virtual servers. For this post I will use an Excel file, Server Info, with the following example information:
Hostname |
Domain |
Role |
Environment |
Location |
Owner |
SCOMMS1 |
SCOM2012.LAB |
Application |
LAB |
Walla Walla, WA |
Minnie Vandermink |
SCOMDC |
SCOM2012.LAB |
DC |
PROD |
Burbank, CA |
Theodore Brian |
SCOMDB |
SCOM2012.LAB |
Database |
LAB |
Walla Walla, WA |
Randal B. Mann |
SCOMDW |
SCOM2012.LAB |
Database |
LAB |
Albuquerque, NM |
Randal B. Mann |
Overview
A. Add a Configuration Dataset to the Performance Data Model
B. Create a Relationship and Refresh Data
C. Make a View for Roles
D. Make a View for Server Statistics
Step by step
A. Add a Configuration Dataset to the Performance Data Model
Open Perf 7d Model in Excel
Select Manage from the Data Model section of the POWERPIVOT menu
In the Power Pivot model, click From Other Sources in the Get External Data section of the ribbon
Select Excel File from the Table Import Wizard then click Next >
Click Browse
Select Server Info and click Open
Check Use first row as column headers. then click Next >
Click Finish then click Close
B. Create a Relationship and Refresh Data
Click the Diagram View in the View section of the ribbon
Resize and arrange the datasets
Make the relationships by clicking and dragging the field in the From column to the field in the To column
From
To
Entity: Hostname
Server Info: Hostname
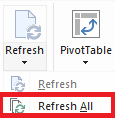
Select Refresh All from the Refresh pulldown in the ribbon
Click Close when the refresh is complete
Close the Power Pivot window
Click OK in the Power View dialog window
Save the workbook
C. Make a View for Roles
Click Power View From the Insert section of the ribbon
Enter Performance Summary by Role in the Click here to add a title field
Adjust the text if desired (I used 20 point and bold)
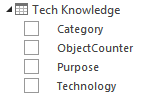
Expand the Tech Knowledge dataset
Drag the Technology field from the Tech Knowledge dataset into the Filters section
Select OS
Drag the Category field from the Tech Knowledge dataset into the Filters section
Select CPU, Memory, Network, and Storage
Expand the Object and Counter dataset
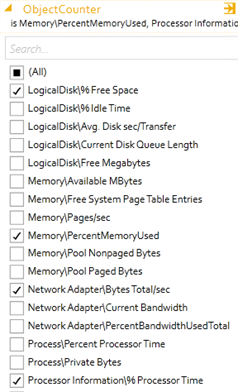
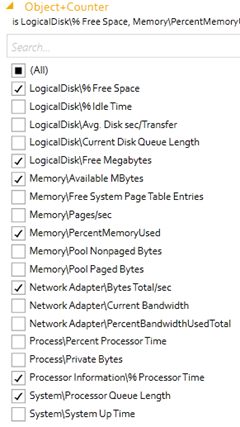
Drag the Object+Counter field from the Object and Counter dataset into the Filters section
Select a representative counter for the LogicalDisk, Memory, Network Adapter, and Processor Information objects
Expand the Perf dataset
Check the boxes for DateTime and avg_avg
Select Line from the Other Chart pulldown in the Switch Visualization section of the ribbon
Select None from the Title pulldown in the Labels section of the ribbonin the Layout menu
Drag Category from the Tech Knowledge dataset into the TILE BY field for the line chart
Expand the Server Info dataset
Drag Role from the Server Info dataset into the Legend field for the line chart
Resize the tile space and the line chart to make room for a table and a bar chart
Click in the open tile space
Click ALL in the Power View Fields section
Check the box for Object+Counter from the Object and Counter dataset
Check the boxes for min_min, avg_min, avg_avg, avg_max, and max_max from the Perf dataset
Select None from the Totals pulldown in the Options section of the ribbon
Resize the table and arrange it so it doesn't overlap with the line chart
Click in the open tile space
Check the box for Environment from the Server Info dataset
Check the box for avg_avg from the Perf dataset
Select Stacked Bar from the Bar Chart pulldown in the Switch Visualization section of the ribbon
Select None from the Title pulldown in the Labels section of the ribbonin the Layout menu
Expand the Entity dataset
Drag Hostname from the Entity dataset to the Axis field
Change the sort order of the bar chart to use avg_avg in descending order
Resize the bar chart and arrange it so it doesn't overlap with the table
Rename the tab to Role Summary
D. Make a View for Server Statistics
Click Power View From the Insert section of the ribbon
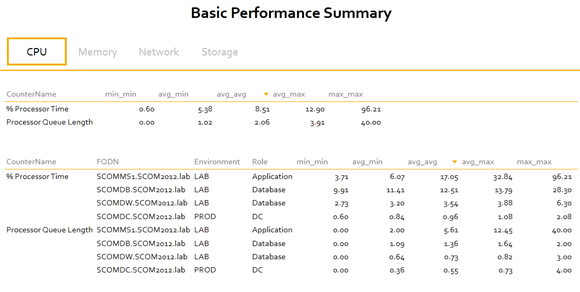
Enter Basic Performance Summary in the Click here to add a title field
Adjust the text if desired
Drag the Technology field from the Tech Knowledge dataset into the Filters section
Select OS
Drag the Category field from the Tech Knowledge dataset into the Filters section
Select CPU, Memory, Network, and Storage
Drag the Object+Counter field from the Object and Counter dataset into the Filters section
Select any desired counters
Check the box for Counter from the Object and Counter dataset
Check the box for FQDN from the Entity dataset
Check the boxes for Environment and Role from the Server Info dataset
Check the boxes for min_min, avg_min, avg_avg, avg_max, and max_max from the Perf dataset
Select Matrix from the Table pulldown in the Switch Visualization section of the ribbon
Select None from the Totals pulldown in the Options section of the ribbon
Drag Category from the Tech Knowledge dataset into the TILE BY field for the line chart
Resize the matrix and tile space and leave room for another matrix above it
Select the matrix
Press Ctrl-C to copy the matrix
Press Ctrl-V to paste the matrix
Select Rows – Enable Drill Down One Level at a Time from the Show Levels pulldown from the Options section of the ribbon
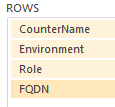
Drag FQDN to the bottom of the rows list
Resize the table so it doesn't overlap with the other table
Rename the tab to Basic Summary
Save the workbook
Comments
- Anonymous
January 01, 2003
Thank you. - Anonymous
August 15, 2014
One can convert a seven day performance model to a 26 week model without a lot of trouble. I chose 182 - Anonymous
August 15, 2014
One can convert a seven day performance model to a 26 week model without a lot of trouble. I chose 182 - Anonymous
August 17, 2014
Power View allows the correlation of a large amount of data as long as a relationship exists. The datasets - Anonymous
September 01, 2014
I use the SCOM Data Warehouse model for a variety of administrative and analytical activities. Sometimes


