SCOM Performance Data and Power View
In a previous post (<www.scom2k7.com/performance-reporting-with-power-view/>) I presented a simple example of performance reporting using Power View in Excel 2013. The purpose of this post is to update the performance model for scalability and customization. Power View has limits on the volume of data and the presentation area which influence the design of the Power Pivot data model. My primary goal is to maximize the speed at which I can view data in a clear, meaningful way. I will provide an outline of the data model, the SQL queries to populate it, and the DAX statements to manipulate the data. The procedure for adding the data source and datasets has not changed from the previous post, and I will skip the specific steps here.
I use a data model similar to the performance dataset in the Operations Manager Data Warehouse schema (technet.microsoft.com/en-us/library/gg508713.aspx). However, I go from the instances (vPerformanceRuleInstance) to the objects and counters (vPerformanceRule) before going to the data collection rules (vRule). The object\counter pairing forms a unique string for combining with technical knowledge. I should point out that my use of the term "technical knowledge" refers to an arbitrary set of attributes for describing performance counters. For example, I might describe "LogicalDisk\Avg. Disk sec/Transfer" like this:
Object+Counter |
Technology |
Category |
Purpose |
LogicalDisk\Avg. Disk sec/Transfer |
OS |
Storage |
Latency |
This helps keep values visible in tiles and legends while communicating the meaning to an audience. The attributes become useful in filtering, too. For this post I will use an Excel workbook for storing technical knowledge, but these could be columns in a SQL table, SQL query or calculated columns in the data model.
Overview
A. Create Performance Data Model
B. Add Measures and Calculated Columns
C. Add Attributes for Object\Counter Values
D. Create Relationships
E. Make a View for All Servers
F. Make a View for Individual Servers
Step by step
A. Create Performance Data Model
Set up Excel 2013
Create a data source for the SCOM Data Warehouse with the following query:
/*Perf*/
SELECT PERF.ManagedEntityRowId
, PERF.PerformanceRuleInstanceRowId
, PERF.DateTime
, PERF.AverageValue
, PERF.MinValue
, PERF.MaxValue
, PERF.SampleCount
FROM Perf.vPerfHourly PERF
INNER JOIN vPerformanceRuleInstance PRI ON PRI.PerformanceRuleInstanceRowId = PERF.PerformanceRuleInstanceRowId
INNER JOIN vPerformanceRule PR ON PR.RuleRowId = PRI.RuleRowId
WHERE PERF.DateTime >(GETUTCDATE() - 7)
ORDER BY PERF.DateTime
Add additional datasets for each of the following queries:
/*Object and Counter*/
select *
from vPerformanceRule PR
/*Instance*/
select *
from vPerformanceRuleInstance PRI
/*Rule*/
select RU.RuleRowId
, RU.ManagementPackRowId
, RU.RuleDefaultName
from vRule RU
inner join vPerformanceRule PR on PR.RuleRowId = RU.RuleRowId
/*MP*/
SELECT distinct MP.ManagementPackRowId
,MP.ManagementPackDefaultName
,MP.ManagementPackSystemName
FROM vManagementPack MP
inner join vRule RU on RU.ManagementPackRowId = MP.ManagementPackRowId
inner join vPerformanceRule PR on PR.RuleRowId = RU.RuleRowId
/*Entity*/
select distinct
ME.ManagedEntityRowId
, MET.ManagedEntityTypeDefaultName as METype
, TLMET.ManagedEntityTypeDefaultName as TLMEType
, ME.TopLevelHostManagedEntityRowId
, ME.ManagementGroupRowId
, ME.Name
, ME.DisplayName
, ME.Path
, ME.ManagedEntityTypeRowId
from Perf.vPerfDaily PERF
inner join vManagedEntity ME on ME.ManagedEntityRowId = PERF.ManagedEntityRowId
inner join vManagedEntityType MET on MET.ManagedEntityTypeRowId = ME.ManagedEntityTypeRowId
inner join vManagedEntity TLME on TLME.ManagedEntityRowId = ME.TopLevelHostManagedEntityRowId
inner join vManagedEntityType TLMET on TLMET.ManagedEntityTypeRowId = TLME.ManagedEntityTypeRowId
where PERF.DateTime >(GETUTCDATE() - 7)
order by ME.ManagedEntityTypeRowId
Note: The vPerformanceRule and vPerformanceRuleInstance views could be added as tables, but I prefer to use queries in case I want to add conditions later. For example, if I want to exclude LogicalDisk counters or dynamic instances.
B. Add Measures and Calculated Columns
Add a Column to the Perf dataset and rename it
DAX
Column Name
=DATEVALUE([DateTime])
Date
Click an empty field in the section below the data columns
Enter max_max:=MAX([MaxValue]) in the function field (right below the ribbon) to create a measure
Add additional measures for other statistics
Measure Name and DAX
avg_max:=AVERAGE([MaxValue])
avg_avg:=AVERAGE([AverageValue])
avg_min:=AVERAGE([MinValue])
min_min:=MIN([MinValue])
Add a column to the Object and Counter dataset and rename it
DAX
Column Name
=CONCATENATE(CONCATENATE([ObjectName],"\"),[CounterName])
Object+Counter
Add columns to the Entity dataset and rename them
DAX
Column Name
=IF([TopLevelHostManagedEntityRowId]=[ManagedEntityRowId],1,0)
TLME
=IF([TLME]=1,[DisplayName], [Path])
FQDN_Rough
=MID([FQDN_Rough],1,FIND(";",[FQDN_Rough],1,255)-1)
FQDN
=MID([FQDN],1,FIND(".",[FQDN],1,255)-1)
Hostname
=MID([FQDN],FIND(".",[FQDN],1,255)+1,255)
Domain
=MID([Domain],1,FIND(".",[Domain],1,255)-1)
Domain_Short
Add a measure to the Entity dataset
Measure Name and DAX
Host_Count:=DistinctCount([FQDN])
C. Add Attributes for Object\Counter Values
Open a new Excel workbook
Copy the Object+Counter column from the Object and Counter dataset
Paste the Object+Counter column into the new workbook
Create columns for Technology, Category, and Purpose
Enter desired values in the columns for any or all counters (empty cells will show as "Blank" in Power View). For example:
Object+Counter
Technology
Category
Purpose
LogicalDisk\Avg. Disk sec/Transfer
OS
Storage
Latency
LogicalDisk\Current Disk Queue Length
OS
Storage
Activity
ManagementGroupAlerts\AlertsCount
SCOM
MG
Activity
Memory\Available MBytes
OS
Memory
Capacity
Memory\PercentMemoryUsed
OS
Memory
Capacity
Network Adapter\Bytes Total/sec
OS
Network
Activity
Processor Information\% Processor Time
OS
CPU
Capacity
System\Processor Queue Length
OS
CPU
Activity
System\System Up Time
OS
System
Availability
Rename the worksheet to Tech Knowledge
Save the workbook as Perf Tech Knowledge
Close the workbook
In the Power Pivot model, click From Other Sources in the Get External Datasection of the ribbon
Select Excel File from the Table Import Wizard then click Next >
Click Browse
Select Perf Tech Knowledge and click Open
Check Use first row as column headers. then click Next >
Click Finish then click Close
D. Create Relationships
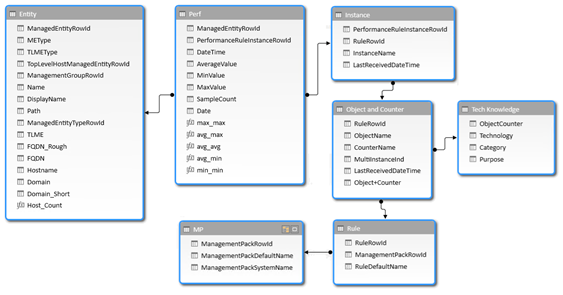
Click the Diagram View in the View section of the ribbon
Resize and arrange the datasets
Make the relationships by clicking and dragging the field in the From column to the field in the To column
From
To
Perf: ManagedEntityRowId
Entity: ManagedEntityRowId
Perf: PerformanceRuleInstanceRowId
Instance: PerformanceRuleInstanceRowId
Instance: RuleRowId
Object and Counter: RuleRowId
Object and Counter: RuleRowId
Rule: RuleRowId
Object and Counter: Object+Counter
Tech Knowledge: ObjectCounter
Rule: ManagementPackRowId
MP: ManagementPackRowId
Review the diagram
Save the workbook as Perf 7d Model
Close the Power Pivot window
E. Make a View for All Servers
From the Insert menu click Power View from the Reports section of the ribbon
Select Module from the Themes pulldown in the Themes section of the ribbon
Enter Performance Summary in the Click here to add a title field
Adjust the text if desired (I used 20 point and bold)
Expand the Tech Knowledge dataset
Drag the Technology field from the Tech Knowledge dataset into the Filters section
Select OS
Expand the Object and Counter dataset
Drag the Object+Counter field from the Object and Counter dataset into the Filters section
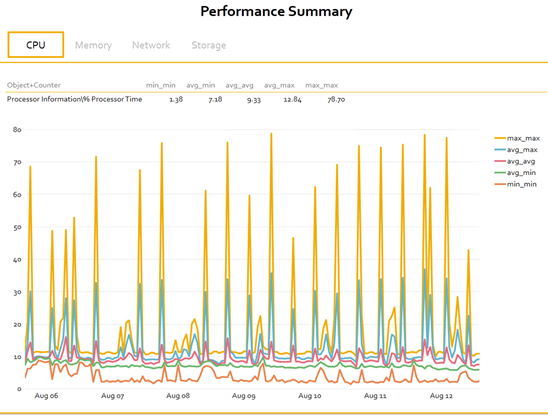
Select a representative counter for the LogicalDisk, Memory, Network Adapter, and Processor Information objects
Expand the Perf dataset
Check the boxes for DateTime, max_max, avg_max, avg_avg, avg_min, and min_min (the order of the values determines their placement in the legend)
Select Line from the Other Chart pulldown in the Switch Visualization section of the ribbon
Select None from the Title pulldown in the Layout menu
Drag Category from the Tech Knowledge dataset into the TILE BYfield for the line chart
Resize the tile space and the line chart to make room for a table
Click in the open tile space
Click ALL in the Power View Fields section
Check the box for Object+Counter from the Object and Counter dataset
Check the boxes for min_min, avg_min, avg_avg, avg_max, and max_max from the Perf dataset
Select None from the Totals pulldown in the Options section of the ribbon
Resize the table and arrange it so it doesn't overlap with the line chart
Rename the tab to Perf Summary
F. Make a View for Individual Servers
Click Power View From the Insert section of the ribbon
Enter CPU Performance by Server in the Click here to add a title field
Adjust the text if desired
Drag the Technology field from the Tech Knowledge dataset into the Filters section
Select OS
Drag the Category field from the Tech Knowledge dataset into the Filters section
Select CPU
Drag the Object+Counter field from the Object and Counter dataset into the Filters section
Select Processor Information\% Processor Time
Check the boxes for DateTime, avg_max, avg_avg, and avg_min from the Perf dataset
Select Line from the Other Chart pulldown in the Switch Visualization section of the ribbon
Select None from the Title pulldown in the Layout menu
Expand the Entity dataset in the Power View Fields section
Drag Hostname from the Entity dataset into the TILE BY field for the line chart
Resize the tile space and the line chart to make room for a table
Click in the open tile space
Click ALL in the Power View Fields section
Check the box for FQDN from the Entity dataset
Check the box for Object+Counter from the Object and Counter dataset
Check the boxes for min_min, avg_min, avg_avg, avg_max, and max_max
Select None from the Totals pulldown in the Options section of the ribbon
Resize the table and arrange it so it doesn't overlap with the line chart
Rename the tab to Server CPU
Save the workbook
Comments
- Anonymous
January 01, 2003
I added some steps to describe adding measures. I changed "metric" to "measure," too. - Anonymous
January 01, 2003
Thanks - Anonymous
August 14, 2014
Configuration data combines very well with performance data collected by SCOM. The usefulness of a configuration - Anonymous
August 15, 2014
One can convert a seven day performance model to a 26 week model without a lot of trouble. I chose 182 - Anonymous
August 18, 2014
Great post many thanks - Anonymous
August 27, 2014
If one built a short-term performance model for SCOM and converted it to long-term , then one might want - Anonymous
March 14, 2015
Thanks. Very nice work. - Anonymous
April 23, 2015
This is causing a problem in DAX. (B5)
=CONCATENATE(CONCATENATE([ObjectName],""),[CounterName])
It's complaining about the ""
How do I resolve this issue?
Thanks. - Anonymous
April 23, 2015
Nevermind, replaced the "," with ";" and it worked. - Anonymous
April 23, 2015
When creating the following link I receive the following error. Please help.
Object and Counter: Object+Counter - Tech Knowledge: ObjectCounter
The relationship cannot be created because each column contains duplicate values. Select at least one column that contains only unique values.
Thank you in advance. - Anonymous
April 23, 2015
Dean, the lookup is a many to one relationship. The Tech Knowledge: ObjectCounter list should have unique values. You can use Data --> Remove Duplicates in Excel to fix the error.


