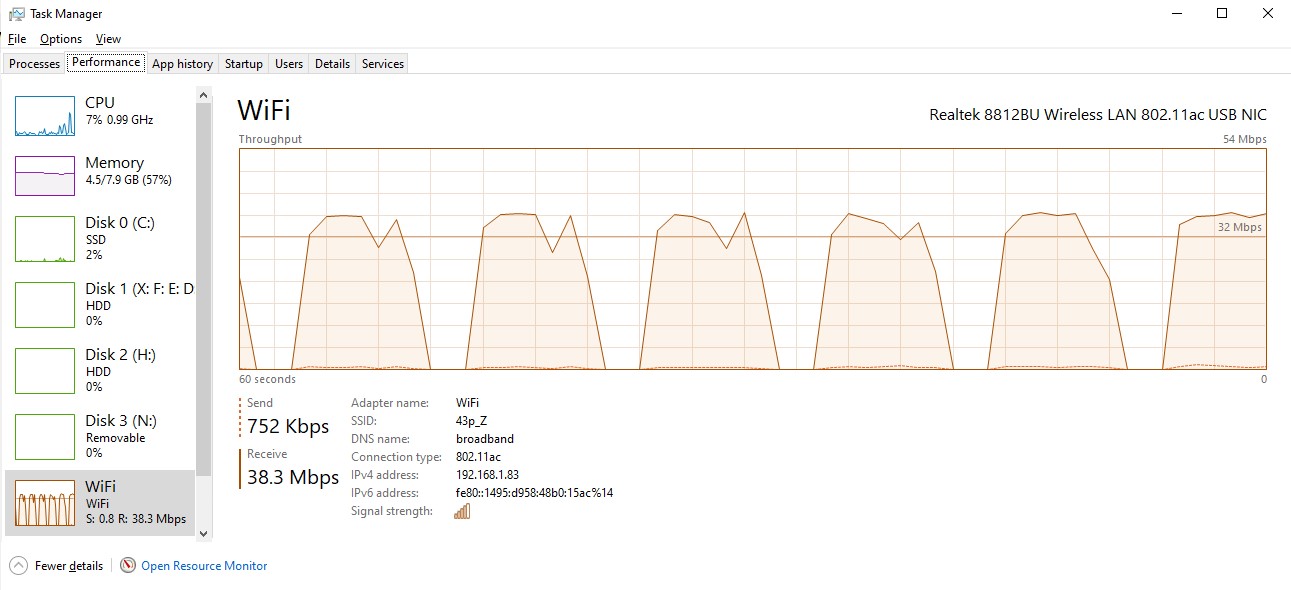
Network throughput drops to 0Kbps (send and recieve) every 8 seconds, adapter fine on other PCs

Nick Brown 26 Reputation points
2021-12-27T12:01:01.723+00:00

System:
HP 290 G1 Microtower PC
Processor Intel(R) Core(TM) i5-7500 CPU @ 3.40GHz 3.40 GHz
Installed RAM 8.00 GB (7.89 GB usable)
Device ID EA9D01FF-A2BC-4AF7-99C6-36A4BAF78CC2
Product ID 00330-50826-60474-AAOEM
System type 64-bit operating system, x64-based processor
Edition Windows 10 Pro
Version 21H1
Installed on ‎12/‎07/‎2021
OS build 19043.1415
Experience Windows Feature Experience Pack 120.2212.3920.0

Issue :
Wifi speed drops to 0Kbps every 10 seconds or so for about 2 seconds both send and receive
I have two identical USB Wifi adapters and it’s the same for both adapters but just when in this PC.

Resource monitor shows the same issue
What I have tried:

  • Testing with data from the web or transferring data from my NAS on the same subnet. Both have the issue so it’s not an issue with broadband.
  • Swapped to another identical 802.11ac USB network adaptor – they both work fine in another machine – so I don’t think the adapter is the issue.
  • Switch to another brand adapter (802.11n only) – works fine
  • Another PC with this adapter in the same room has no problems and is on same wifi 5GHz channel so that rules out the Wifi signal having problems. Same wifi/network setup, same driver, same update version of windows.
  • Tried manual DNS configuration to 8.8.8.8 and 8.8.4.4
  • Latest update to router
  • Latest update to Windows
  • Latest f/w for adapters
  • Latest BIOS for PC
  • Turned off adapter power management
  • Tried latest manufacturer and latest MS drivers for adapter
  • Different USB ports tried both 2.0 and 3.0
  • Airplane mode on/off
  • Router reboot (full power off)
  • PC reboot (full power off)
  • “Forget” and reattach to network
  • Uninstalled VPN
  • Reboot with all start-up programs and all non-Microsoft services disabled
  • Link speed to router checked = 585Mbps
  • Set the adapter as the only connection on the 5GHz channel
  • Set the adapter as the only connection on the 2.4GHz channel
  • Tried Static and DHCP IPV4 addressing
  • Network RESET in settings
  • Network troubleshooter
  • Network Adapter Troubleshooter
  • Incoming Connections troubleshooter
  • Internet Connections troubleshooter
  • HP Network Check
  • Tried switching off local firewall
  • Tried switching off router firewall
  • HP Hardware diagnostics 1.8.0.0

Hardware properties:
SSID: xxxxxxxx
Protocol: Wi-Fi 5 (802.11ac)
Security type: WPA2-Personal
Network band: 5 GHz
Network channel: 60
Link speed (Receive/Transmit): 585/585 (Mbps)
Link-local IPv6 address: xxxx::xxxx:xxxx:xxxx:xxxxxx
IPv6 DNS servers: xxxx::xxxx:xxxx:xxxx:xxxxxx
IPv4 address: 192.168.1.83
IPv4 DNS servers: 192.168.1.1
DNS suffix search list: broadband
Manufacturer: Realtek Semiconductor Corp.
Description: Realtek 8812BU Wireless LAN 802.11ac USB NIC
Driver version: 1030.38.712.2019
Physical address (MAC): 1C-BF-CE-7D-75-D4

I have spent so many hours on this - it's driving me nuts. Any input or suggestions gratefully received.

Thanks in advance

Nick

Windows 10 Network
Windows 10 Network
Windows 10: A Microsoft operating system that runs on personal computers and tablets.Network: A group of devices that communicate either wirelessly or via a physical connection.
2,364 questions
{count} votes

Accepted answer
  1. Gary Nebbett 6,091 Reputation points
    2022-01-03T09:05:42.89+00:00

    Hello Nick,

    There are lots of possible next steps, but rather than spending effort weighing the merits of each, let's just start with a simple test:

    • Issue the command netsh trace start report=disabled overwrite=yes provider=Microsoft-Windows-WLAN-AutoConfig tracefile=why.etl.
    • Wait 3 or so minutes.
    • Issue the command netsh trace stop.
    • Issue the command netsh trace convert why.etl why.txt

    There should be some readable information in why.txt.

    Looking directly at why.etl using my tools and filtering some junk, I see on my system:

    161864-image.png

    The events highlighted in green happened when I performed a search in Google - I have enabled Google to request my location when performing searches.

    I think that we will see a scan being initiated every 10 seconds on your PC and, if so, we will then have to search for the client that requested the scan.

    Gary
    1 person found this answer helpful.

24 additional answers

Sort by: Most helpful
  1. Nick Brown 26 Reputation points
    2021-12-27T14:03:13.373+00:00

    @Gary Nebbett

    Hi Gary,

    Thank you so much for your response.

    You are obviously a very clever man and I have to commend you on your willingness to help others. 30 years ago I was a software engineer and things have moved on but I can still manage quite a lot of stuff. (Now a Paramedic!)

    I think that I have achieved what you suggested for Dan Evans and attach the two files recommended.

    I used Ookla to create data transfer. If it helps I can transfer files from my NAS and also with no non-microsoft services running if that makes the analysis easier?

    In the WPR trace the throughput dropped about 8s into the download (similar for upload) and in the TCP/IP trace it was about 15s I think for the download.

    Sorry if this is not what was needed - happy to persist in trying to find the issue.

    WPR-why.etl

    TCP-why.etl

    Kind Regard

    Nick

    0 comments No comments

  2. Gary Nebbett 6,091 Reputation points
    2021-12-27T17:09:23.45+00:00

    @Nick Brown

    Hello Nick,

    Thanks for those traces - they help to narrow down the search for an explanation.

    In both the transmit (upload) and receive (download) sections of the trace data, data transfer stops because no received packets are being reported to the TCP/IP stack. The transmit (upload) transfer stops when the receive or congestion windows are fully used up (since no acknowledgements are received, the available space in the windows fall to zero).

    The process of reporting a received packet to the TCP/IP stack is as follows:

    • The network adapter interrupts the CPU; the interrupt handler gathers some information about the cause of the interrupt and then schedules a DPC (Deferred Procedure Call) to continue processing of the received data in a less time-sensitive context (i.e. not at interrupt level).
    • When the processor interrupt level falls to dispatch level or lower, the DPC runs; some adapter drivers report the packet to the TCP/IP stack directly from the DPC and some drivers defer processing the data yet again - using NdisQueueIoWorkItem to queue the work to a thread in the System process. The driver for your adapter uses NdisQueueIoWorkItem.

    No packets seem to be lost as a result of the "pause" in delivery, and only one or two packets are retransmitted (for an upload) - the sent packets are buffered somewhere (probably in a queue of NDIS I/O work items).

    My guess is that something is interfering with the dispatching of the NDIS IoWorkItem. Once I have an idea about how to troubleshoot this further, I will post again.

    Gary

    0 comments No comments

  3. Nick Brown 26 Reputation points
    2021-12-27T17:33:39.543+00:00

    Blimey !

    Even as an ex-techy I am impressed, as I understood rather little of that.

    I have spent the last 2 hours playing with WPA but would never have been able to figure that one out!

    Thank you so much for your continued time and effort

    Nick

    0 comments No comments

  4. Gary Nebbett 6,091 Reputation points
    2021-12-27T18:39:16.537+00:00

    @Nick Brown

    [This response may also be present as a comment - the Microsoft Q & A user interface reported errors (something along the lines of "There is a previous version saved. Would you like to load it or discard it?". I tried both Yes and No, and the site then said that the response had been submitted for moderation...]

    Hello Nick,

    Could you try "pinging" a local system for about 50 seconds? The output might be something like this:

    ping -n 50 192.168.0.1

    Pinging 192.168.0.1 with 32 bytes of data:
    Reply from 192.168.0.1: bytes=32 time=2ms TTL=64
    Reply from 192.168.0.1: bytes=32 time=3ms TTL=64
    Reply from 192.168.0.1: bytes=32 time=3ms TTL=64
    Reply from 192.168.0.1: bytes=32 time=4ms TTL=64
    [...]
    Reply from 192.168.0.1: bytes=32 time=3ms TTL=64
    Reply from 192.168.0.1: bytes=32 time=3ms TTL=64
    Reply from 192.168.0.1: bytes=32 time=3ms TTL=64

    Ping statistics for 192.168.0.1:
    Packets: Sent = 50, Received = 50, Lost = 0 (0% loss),
    Approximate round trip times in milli-seconds:
    Minimum = 2ms, Maximum = 18ms, Average = 4ms

    What I am looking for here is whether the regular "pause" (every 8 seconds or so) also occurs when there is no heavy network load. If it does, that should be visible in the ping response times.

    In order to avoid generating massive trace files full of network activity, it would be useful to know whether any simpler (and lower volume) test scenario can usefully be traced.

    Gary

    0 comments No comments

Your answer

Answers can be marked as Accepted Answers by the question author, which helps users to know the answer solved the author's problem.