Windows 10 Network
Windows 10: A Microsoft operating system that runs on personal computers and tablets.Network: A group of devices that communicate either wirelessly or via a physical connection.
2,395 questions
This browser is no longer supported.
Upgrade to Microsoft Edge to take advantage of the latest features, security updates, and technical support.
' cx='32' cy='32' r='32' /%3E%3Ctext x='50%25' y='55%25' dominant-baseline='middle' text-anchor='middle' fill='%23FFF' %3EDE%3C/text%3E%3C/svg%3E)
This is the first ever time I've used Microsoft Ask a Question, because this is the first ever time I've seen an issue like this and i'm prepared to log the hell of this to help others in the future as I cannot express my frustration.
The Setup
My laptop is wired in, it goes via one unmanaged gigabit switch down to the Unifi Security Gateway, which authenticates to my ISP via PPPoE.
I have a 1Gb FTTP (Fibre to the Premises) Internet connection with a 110Mb upload and on a typical day I can comfortably get 950Mb Down and 107 Up.
There is no QoS, bandwidth limitations or other impacting configurations set on any of my home infrastructure.
I connect through a Dock, Dell WD19 USB-C, which might sound like the cause, but I have also used a USB-A to Ethernet adaptor as well as a USB-C to Ethernet adaptor. There is no built in Ethernet with this laptop. Note that this laptop has worked perfectly fine up until the problem.
The Problem
As of Sunday 5th December 2021, my laptop was found to be off, despite me leaving it on over the weekend. I turned it back on without any issues but then discovered by internet speed was 13.5Mb/s (lower case b) on all speed tests, except Ookla.
Interestingly Ookla's Speedtest.net revealed speeds of up to 400Mb down and 98Up, which is still slower than normal, but gives me a good indication something is broken somewhere. All other speed tests tell me exactly 13.5Mb, consistently and actual download speed is indeed 13.5Mb, despite Speedtest.net's result of >400Mb, my actual download speed is indeed 13.5Mb.
The speed tests carried out are via Edge, Chrome and Firefox browsers.
It affects both Wired and Wireless. Yes, this is not just wired. 13.5Mb on both!
Iperf to external servers reveals 13.5Mbs, I am indeed throttled.
My upload is unaffected running >90Mb/s.
All other devices on my network are running happily at >900Mb/s.
I know the difference between Mb/s and MB/s, I'm measuring network performance not disk performance.
Yes, I've done sfc /scannow, if someone says that I might flip a lid.
Troubleshooting
Let's begin ruling stuff out.
Variables
My laptop is managed by my company's Intune. There are no bandwidth limitation policies in place, but this is a variable I cannot verify.
Conclusions
The fact my laptop can connect to local devices at 1Gb, rules out hardware (cable, switches, docks)
The fact my laptop is still limited at another location, rules out network configuration external to the laptop, including ISP
The fact that Linux Distro works at a Gigabit on the same laptop, tells me it's the Windows OS.
It seems that potentially Windows 10 is indeed throttling my internet connection.
Usually I would just rebuild at this stage, but for a change I want to find the root cause.
I've read people have rebuilt and it still remains, but that would surprise me.
I might have to do that, but naturally as a intune managed device, its going to be a pain.
Hardware
Dell Latitude 7420
i7 1185G7 (4 core, 8 threads)
16GB RAM
NVME 256GB
I have discovered the true cause of this problem.
My laptop has various Dell apps that have had no discovered negative effects up until recently, whereby an application known as Dell Optimizer (ironic), took control of my network card and limited it's performance to 13.5Mb/s.
Here is the video of evidence of this:
Dell Optimizer App - Throttling my Internet Connection
It led me to believe that the Windows Operating System was the cause as I was under the illusion that the only thing that had changed recently was Windows updates.
In fact, this application self updates and there is no evidence of any change to it or it’s version. Strange I know but I think the application has self repaired, restoring it to defaults, thus not changing any files but instead deleting its own config. Unfortunately, by default, is that it takes over the network adapter. What a stupid default.
It was discovered off the back of the fact that the only setting in the network adapter that made any impact was the Priority and VLAN setting.
Looking up what this setting does, it is indeed related to 802.1p (QoS). It seems that this Dell Optimizer tool is essentially a QoS management tool and when enabled, it bottlenecked my connection to 13.5Mb.
Priority and VLAN setting impacts the "Priority Level Definition", which in short is the configuration you can make within task manager where you can prioritise CPU Resources to specific services. I noticed when carrying out my speed tests to any internet location, not a LAN location, that the Dell Optimiser App began demonstrating CPU/Memory spikes along with networking traffic.
Once I found the app, I realised that it was enabled to "optimise" my network cards. (Wifi and Ethernet).
Once turned off my speed test immediately went back up to the actual speed provided to me by my Internet Service Provider.
May I pass on my thanks tremendously to @Anonymous for his incredible determination to help discover the cause by analysing deep level knowledge of network data.
It was always going to be something stupid, but I can let Microsoft off the hook with this one and point all my blame to the OEM Dell. It felt like software, it was software, case resolved.
Dell - Fix your Optimiser, what on earth is the point of it.

Hello @Anonymous ,
Thanks for that update and your willingness to share trace data - I am glad that it ended happily.
For the benefit of other readers who might wonder how one could have proceeded with the tracing approach to identifying the cause of the problem, the next step might have been to capture stack traces when "interesting" events (such as TcpRscNblOobInfo, in this case) occur. The data might have looked something like this:
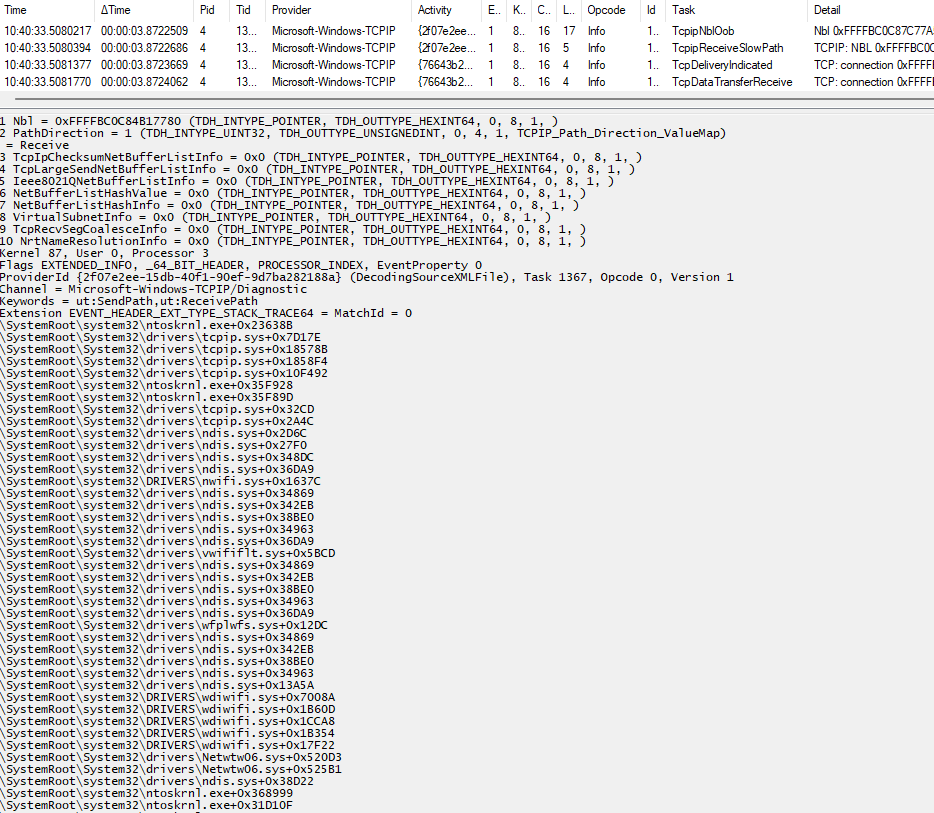
There is a good chance that the Dell "optimizer" would have appeared on the stack; since one might only expect to see Microsoft components and the adapter specific miniport driver (Netwtw06.sys, in the sample above), the foreign/unexpected component would have become the focus of attention.
A dilemma for those who request trace data is making clear the type of data that will be collected and its possible implications for confidentiality. The more complex the trace data, the more difficult it is to give guidance on this point, especially considering that the data is made available in an open forum.
Gary
Hi Gary,
I am more than happy to replicate the above again if it's useful to provide further completion of the advanced analysis.
If you let me know the process to obtain the data you are suggesting above, I am happy to turn back on the optimiser, run the scan, but equally then turn off the optimiser and run another.
So we have comparison?
Thanks,
Dan
' cx='32' cy='32' r='32' /%3E%3Ctext x='50%25' y='55%25' dominant-baseline='middle' text-anchor='middle' fill='%23FFF' %3EY%3C/text%3E%3C/svg%3E)
Thank you DanEvans and God bless you!
I just suffered from the same problem. Switched ISPs, Switched routers. Called an external (and very expensive) network expert, and spent hours together trying to solve this. And indeed - it was Dell's optimizer all along...
This REALLY needs to be addressed by them!
' cx='32' cy='32' r='32' /%3E%3Ctext x='50%25' y='55%25' dominant-baseline='middle' text-anchor='middle' fill='%23FFF' %3EM%3C/text%3E%3C/svg%3E)
Another sufferer checking in. I managed to find this thread after googling "internet stuck 13.5". It's such a specific cap and it happened regardless of me being on Ethernet or Wifi. This has been driving me crazy for weeks!! Leaves me to wonder what else Dell might be "Optimizing" for me.
' cx='32' cy='32' r='32' /%3E%3Ctext x='50%25' y='55%25' dominant-baseline='middle' text-anchor='middle' fill='%23FFF' %3ESB%3C/text%3E%3C/svg%3E)
Same problem solved by this post. thank you for this very helpfull response
Hello @Anonymous ,
I am retired and do this just for fun - if you also have time and interest then that is great.
To get a stack trace, using built-in Windows tools, we will have to use Windows Performance Recorder (WPR). WPR is controlled by an XML format (profile) input file (conventionally with the extension .wprp). I have attached a suitable file (with a .txt extension, due to constraints on attachments in this forum) and have also pasted it contents below to make discussion of it easier.
<?xml version="1.0" encoding="utf-8"?>
<!-- wpr -start rsc.wprp!RSC -filemode -->
<!-- wpr -stop ?.etl -->
<WindowsPerformanceRecorder Version="1.0" Author="Gary">
  <Profiles>
    <SystemCollector Id="NTKL" Name="NT Kernel Logger">
      <BufferSize Value="64" />
      <Buffers Value="128" />
    </SystemCollector>
    <EventCollector Id="ETW" Name="ETW">
      <BufferSize Value="64" />
      <Buffers Value="128" />
    </EventCollector>
    <SystemProvider Id="Map">
      <Keywords>
	<Keyword Value="Loader" />
	<Keyword Value="ProcessThread" />
      </Keywords>
    </SystemProvider>
    <EventProvider Id="TCPIP" Name="Microsoft-Windows-TCPIP" NonPagedMemory="true" Level="17" Stack="true">
      <Keywords>
        <Keyword Value="0x200700000000" />
      </Keywords>
    </EventProvider>
    <Profile Id="RSC.Verbose.File" Name="RSC" Description="RSC" DetailLevel="Verbose" LoggingMode="File">
      <Collectors>
        <SystemCollectorId Value="NTKL">
          <SystemProviderId Value="Map" />
        </SystemCollectorId>
        <EventCollectorId Value="ETW">
          <EventProviders>
            <EventProviderId Value="TCPIP" />
          </EventProviders>
        </EventCollectorId>
      </Collectors>
    </Profile>
  </Profiles>
</WindowsPerformanceRecorder>
We need to collect system Loader and Process events in order to map the 64-bit addresses in the stack traces to modules (.DLL, .SYS, etc.); WPR augments these events with information about the versions of the modules. We also need to collect events from Microsoft-Windows-TCPIP using the same keywords as previously (0x200700000000); the Stack="true" attribute creates stack traces for events from this provider.
Assuming that the XML is saved with the name rsc.wprp, the command to start a trace is wpr -start rsc.wprp!RSC -filemode and the command to stop a trace is wpr -stop why.etl.
You could try analysing the captured data yourself with Windows Performance Analyser (WPA) which is dowloadable from the Microsoft store. I would not necessarily recommend this, as WPA would probably download gigabytes of symbolic debug information when trying to analyse the trace. WPA is designed for analysing aggregated data and although it is possible to drill down to individual events and stacks, it is not easy.
We probably don't need to capture much network traffic, since each stack for the TcpRscNblOobInfo event should be the same.
Gary