Explore Azure Monitor in vCore-based Azure Cosmos DB for MongoDB (vCore)
APPLIES TO:
MongoDB vCore
Azure Monitor for vCore-based Azure Cosmos DB for MongoDB provides a metrics view to monitor your account and create dashboards. The Azure Cosmos DB metrics are collected by default, however this feature is only accessible to M40 and above cluster tiers. The CPU percent metric is used to get the consumption for different types of operations. Later you can analyze which operations used most of the committed memory. By default, the consumption data is aggregated at five-minute interval. However, you can change the aggregation unit by changing the time granularity option.
Introduction
Before you begin, you should understand how information is presented and visualized.
It delivers:
- At-scale perspective of your Azure Cosmos DB for MongoDB (vCore) resources across all your subscriptions in a single location. You can selectively scope to only the subscriptions and resources that you're interested in evaluating.
- Drill-down analysis of a particular Azure Cosmos DB for MongoDB (vCore) resource. You can diagnose issues or perform detailed analysis by using the categories of utilization, failures, capacity, and operations. Selecting any one of the options provides an in-depth view of the relevant Azure Cosmos DB for MongoDB (vCore) metrics.
- Customizable experience built on top of Azure Monitor workbook templates. You can change what metrics are displayed, modify or set thresholds that align with your limits, and then save into a custom workbook. Charts in the workbooks can then be pinned to Azure dashboards.
Metrics available today
System Metrics (available on all cluster tiers)
- Committed memory percent: Shows the percentage of the committed memory limit that is allocated by applications on a shard. This metric helps in monitoring the memory usage against the allocated limit.
- CPU percent: Indicates the CPU utilization on a shard.
- High CPU Utilization: If you notice a spike in CPU utilization on average, the best option to maximize performance is to increase the cluster tier. After increasing the tier, monitor the usage to see if it stabilizes.
- Low CPU Utilization: Conversely, if the CPU utilization is consistently low, it is recommended to scale down to a lower cluster tier to save on cost.
- Memory percent: Shows the memory utilization on a shard. For read-heavy workloads, consider using cluster tiers with more RAM to optimize performance and ensure smoother operations.
- Storage percent: Displays the available storage percentage on a shard.
- Storage used: Represents the actual amount of storage used on a shard. This metric is crucial for understanding the storage consumption trends and managing storage resources.
- Monitoring and Management: If storage utilization increases above 80%, users should monitor this more closely. It is recommended to increase the SKU size of the disk to manage storage more effectively.
- Performance Optimization: If write performance is not at the desired level, particularly when running at scale, increasing the disk size can enhance write performance.
- IOPS: Measures the disk IO operations per second on a shard. It provides insights into the read and write performance of the storage system, helping to optimize disk usage.
- Write Heavy Workloads: IOPS is particularly important for write-heavy workloads, especially when operating at scale. If write performance needs to be improved, it is recommended to upgrade the storage disk SKU size rather than increasing the cluster tier.
Database metrics
- Mongo request duration: Captures the end-to-end duration in milliseconds of client MongoDB requests handled by the Mongo cluster, updated every 60 seconds. This metric is vital for assessing the responsiveness and latency of the database operations.
Note
There's no charge to access Database metrics. However, you'll have to be on the M40 cluster tier or higher to access the metrics. For more information on upgrading, please refer to this guide.
View metrics
Sign in to the Azure portal.
Navigate to the existing Azure Cosmos DB for MongoDB vCore cluster page.
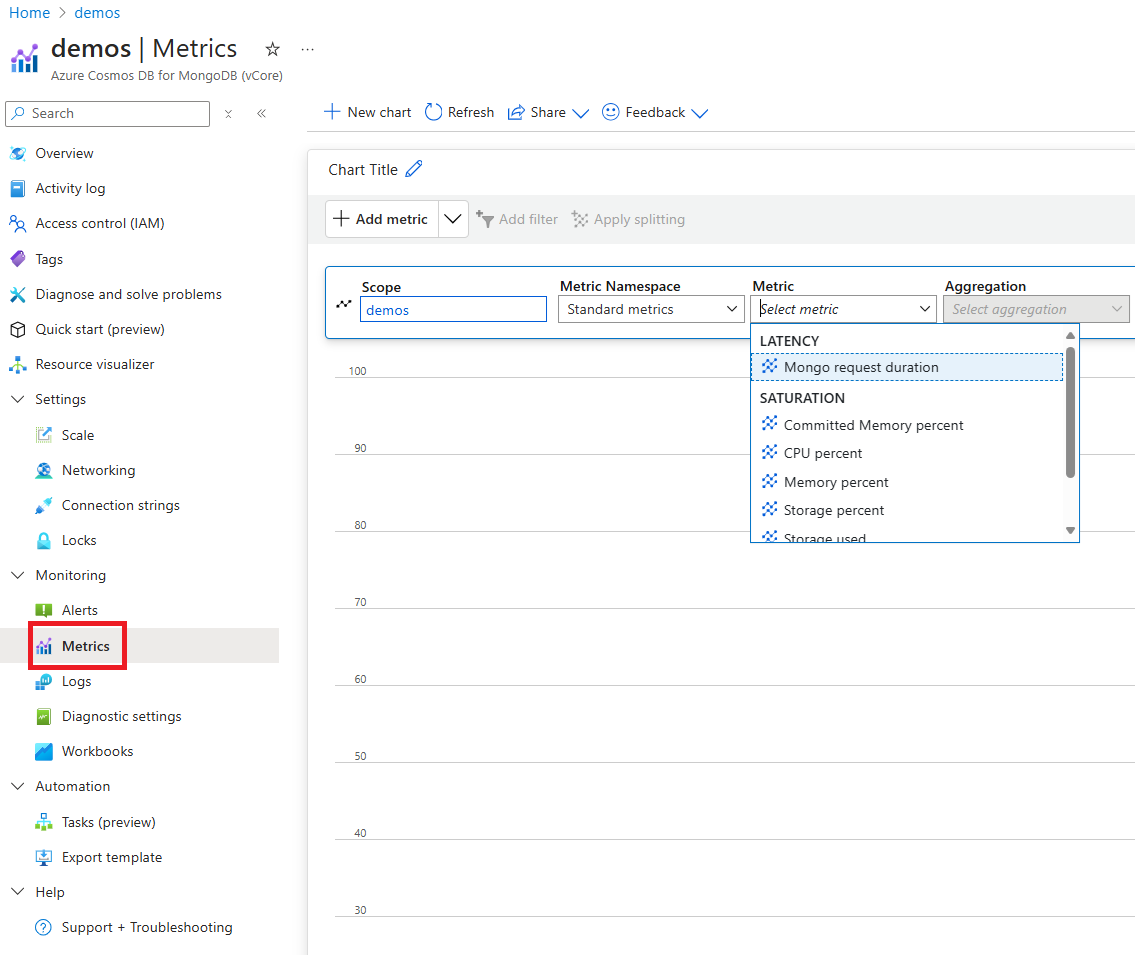
From the Azure Cosmos DB for MongoDB vCore cluster page, select the Metrics navigation menu option.

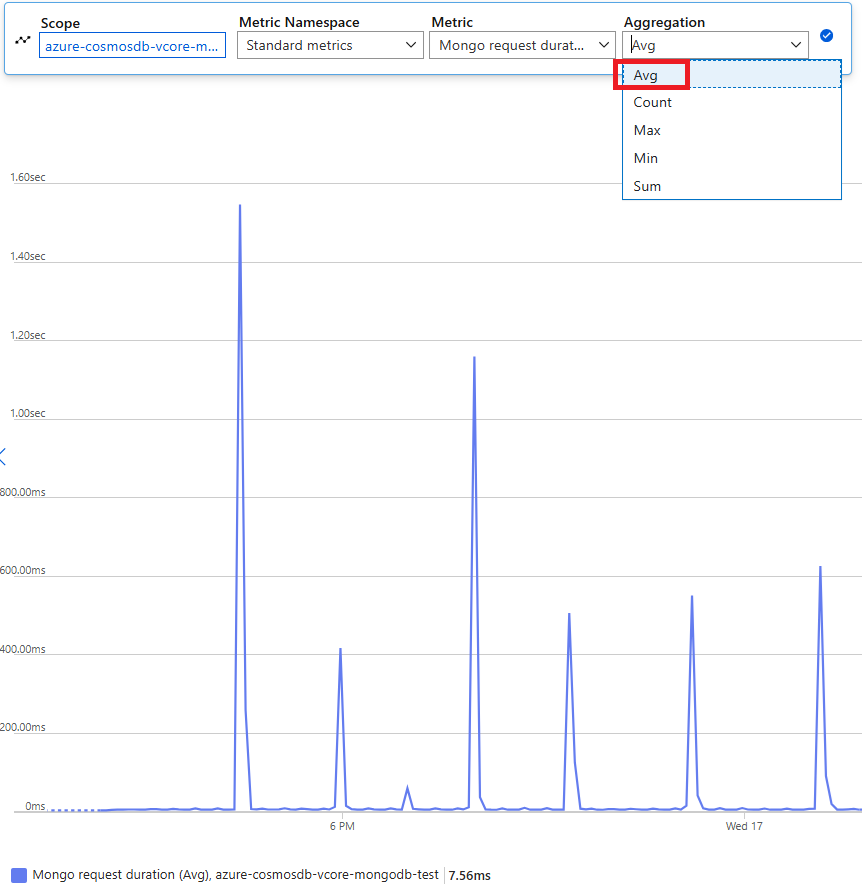
Next select the Monogo request duration metric from the list of available metrics. In this example, let's select Mongo request duration and Avg as the aggregation value. In addition to these details, you can also select the Time range and Time granularity of the metrics. At max, you can view metrics for the past 30 days. After you apply the filter, a chart is displayed based on your filter. You can see the average number of request units consumed per minute for the selected period.

Filters for database metrics
You can also filter metrics and get the charts displayed by a specific CollectionName, DatabaseName, Operation, and StatusCode. The Add filter and Apply splitting options allows you to filter the usage and group the metrics.
If you want to see the usage by collection, select Apply splitting and choose the collection name as a filter. You will see a chart like the following with a choice of collections within the dashboard. You can then select a specific collection name to view more details:

Next steps
- Configure metric alerts to set up automated alerting to aid in detecting issues.