Tutorial: Monitor IoT Edge devices
Applies to: ![]() IoT Edge 1.5
IoT Edge 1.5
Important
IoT Edge 1.5 LTS is the supported release. IoT Edge 1.4 LTS is end of life as of November 12, 2024. If you are on an earlier release, see Update IoT Edge.
Use Azure Monitor workbooks to monitor the health and performance of your Azure IoT Edge deployments.
In this tutorial, you learn how to:
- Understand what metrics are shared by IoT Edge devices and how the metrics collector module handles them.
- Deploy the metrics collector module to an IoT Edge device.
- View curated visualizations of the metrics collected from the device.
Prerequisites
An IoT Edge device with the simulated temperature sensor module deployed to it. If you don't have a device ready, follow the steps in Deploy your first IoT Edge module to a virtual Linux device to create one using a virtual machine.
Understand IoT Edge metrics
Every IoT Edge device relies on two modules, the runtime modules, which manage the lifecycle and communication of all the other modules on a device. These modules are called the IoT Edge agent and the IoT Edge hub. To learn more about these modules, see Understand the Azure IoT Edge runtime and its architecture.
Both of the runtime modules create metrics that allow you to remotely monitor how an IoT Edge device or its individual modules are performing. The IoT Edge agent reports on the state of individual modules and the host device, so creates metrics like how long a module has been running correctly, or the amount of RAM and percent of CPU being used on the device. The IoT Edge hub reports on communications on the device, so creates metrics like the total number of messages sent and received, or the time it takes to resolve a direct method. For the full list of available metrics, see Access built-in metrics.
These metrics are exposed automatically by both modules so that you can create your own solutions to access and report on these metrics. To make this process easier, Microsoft provides the azureiotedge-metrics-collector module that handles this process for those who don't have or want a custom solution. The metrics collector module collects metrics from the two runtime modules and any other modules you may want to monitor, and transports them off-device.
The metrics collector module works one of two ways to send your metrics to the cloud. The first option, which we'll use in this tutorial, is to send the metrics directly to Log Analytics. The second option, which is only recommended if your networking policies require it, is to send the metrics through IoT Hub and then set up a route to pass the metric messages to Log Analytics. Either way, once the metrics are in your Log Analytics workspace, they are available to view through Azure Monitor workbooks.
Create a Log Analytics workspace
A Log Analytics workspace is necessary to collect the metrics data and provides a query language and integration with Azure Monitor to enable you to monitor your devices.
Sign in to the Azure portal.
Search for and select Log Analytics workspaces.
Select Create and then follow the prompts to create a new workspace.
Once your workspace is created, select Go to resource.
From the main menu under Settings, select Agents.
Copy the values of Workspace ID and Primary key, available under 'Log Analytics agent instructions'. You'll use these two values later in the tutorial to configure the metrics collector module to send the metrics to this workspace.
Retrieve your IoT hub resource ID
When you configure the metrics collector module, you give it the Azure Resource Manager resource ID for your IoT hub. Retrieve that ID now.
From the Azure portal, navigate to your IoT hub.
From the menu on the left, under Settings, select Properties.
Copy the value of Resource ID. It should have the format
/subscriptions/<subscription_id>/resourceGroups/<resource_group_name>/providers/Microsoft.Devices/IoTHubs/<iot_hub_name>.
Deploy the metrics collector module
Deploy the metrics collector module to every device that you want to monitor. It runs on the device like any other module, and watches its assigned endpoints for metrics to collect and send to the cloud.
Follow these steps to deploy and configure the collector module:
Sign in to the Azure portal and go to your IoT hub.
From the menu on the left, select Devices under the Device management menu.
Select the device ID of the target device from the list of IoT Edge devices to open the device details page.
On the upper menu bar, select Set Modules.
The first step of deploying modules from the portal is to declare which Modules should be on a device. If you are using the same device that you created in the quickstart, you should already see SimulatedTemperatureSensor listed. If not, add it now:
In the IoT Edge modules section, select Add then choose IoT Edge Module.
Update the following module settings:
Setting Value IoT Module name SimulatedTemperatureSensorImage URI mcr.microsoft.com/azureiotedge-simulated-temperature-sensor:latestRestart policy always Desired status running Select Next: Routes to continue to configure routes.
Add a route that sends all messages from the simulated temperature module to IoT Hub.
Setting Value Name SimulatedTemperatureSensorToIoTHubValue FROM /messages/modules/SimulatedTemperatureSensor/* INTO $upstream
Add and configure the metrics collector module:
Select Add then choose IoT Edge Module.
Search for and select IoT Edge Metrics Collector.
Update the following module settings:
Setting Value IoT Module name IoTEdgeMetricsCollectorImage URI mcr.microsoft.com/azureiotedge-metrics-collector:latestRestart policy always Desired status running
If you want to use a different version or architecture of the metrics collector module, find the available images in the Microsoft Artifact Registry.
Navigate to the Environment Variables tab.
Add the following text type environment variables:
Name Value ResourceId Your IoT hub resource ID that you retrieved in a previous section. UploadTarget AzureMonitorLogAnalyticsWorkspaceId Your Log Analytics workspace ID that you retrieved in a previous section. LogAnalyticsSharedKey Your Log Analytics key that you retrieved in a previous section. For more information about environment variable settings, see Metrics collector configuration.
Select Apply to save your changes.
Note
If you want the collector module to send the metrics through IoT Hub, you would add a route to upstream similar to
FROM /messages/modules/< FROM_MODULE_NAME >/* INTO $upstream. However, in this tutorial we're sending the metrics directly to Log Analytics. Therefore, it's not needed.Select Review + create to continue to the final step for deploying modules.
Select Create to finish the deployment.
After completing the module deployment, you return to the device details page where you can see four modules listed as Specified in Deployment. It may take a few moments for all four modules to be listed as Reported by Device, which means that they've been successfully started and reported their status to IoT Hub. Refresh the page to see the latest status.
Monitor device health
It may take up to fifteen minutes for your device monitoring workbooks to be ready to view. Once you deploy the metrics collector module, it starts sending metrics messages to Log Analytics where they're organized within a table. The IoT Hub resource ID that you provided links the metrics that are ingested to the hub that they belong to. As a result, the curated IoT Edge workbooks can retrieve metrics by querying against the metrics table using the resource ID.
Azure Monitor provides three default workbook templates for IoT:
- The Fleet View workbook shows the health of devices across multiple IoT resources. The view allows configuring thresholds for determining device health and presents aggregations of primary metrics, per-device.
- The Device Details workbook provides visualizations around three categories: messaging, modules, and host. The messaging view visualizes the message routes for a device and reports on the overall health of the messaging system. The modules view shows how the individual modules on a device are performing. The host view shows information about the host device including version information for host components and resource use.
- The Alerts workbook View presents alerts for devices across multiple IoT resources.
Explore the fleet view and health snapshot workbooks
The fleet view workbook shows all of your devices, and lets you select specific devices to view their health snapshots. Use the following steps to explore the workbook visualizations:
Return to your IoT hub page in the Azure portal.
Scroll down in the main menu to find the Monitoring section, and select Workbooks.
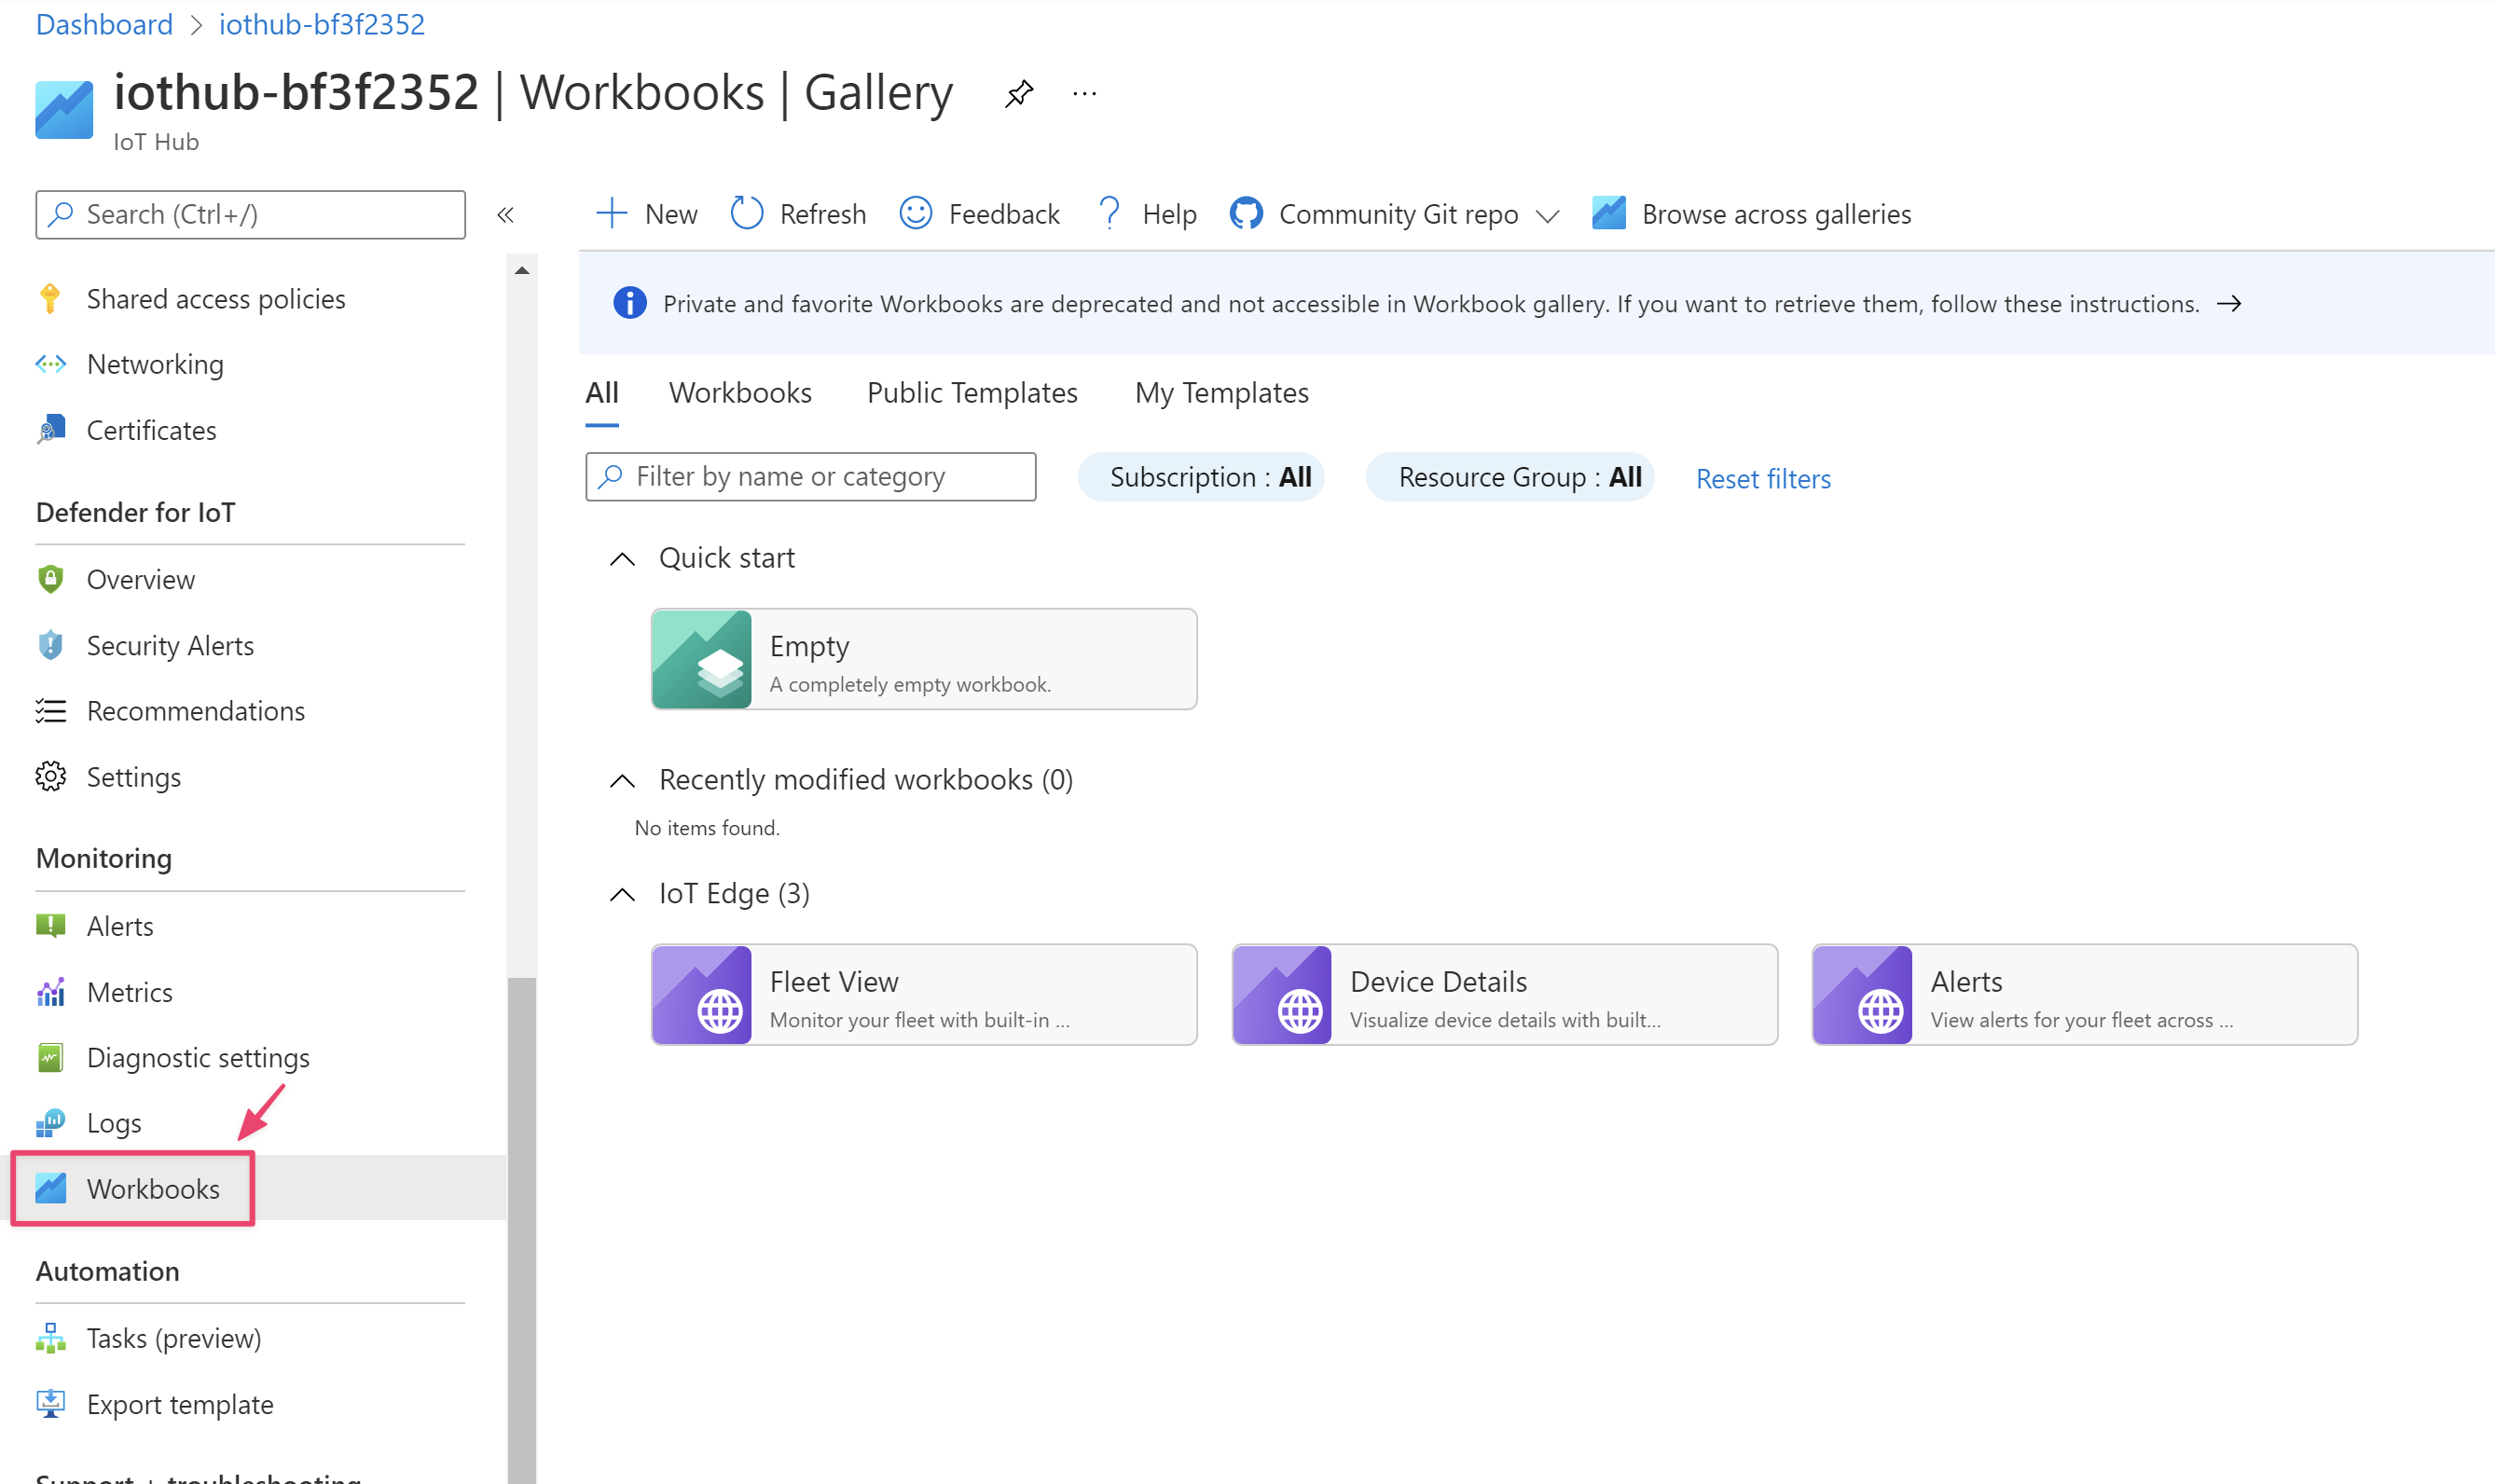
Select the Fleet View workbook.
You should see your device that's running the metrics collector module. The device is listed as either healthy or unhealthy.
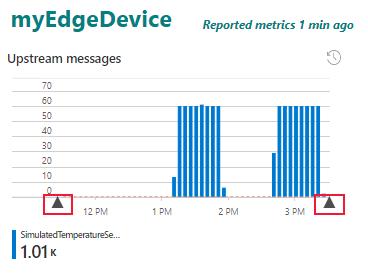
Select the device name to view detailed metrics from the device.
On any of the time charts, use the arrow icons under the X-axis or select the chart and drag your cursor to change the time range.
Close the health snapshot workbook. Select Workbooks from the fleet view workbook to return to the workbooks gallery.
Explore the device details workbook
The device details workbook shows performance details for an individual device. Use the following steps to explore the workbook visualizations:
From the workbooks gallery, select the IoT Edge device details workbook.
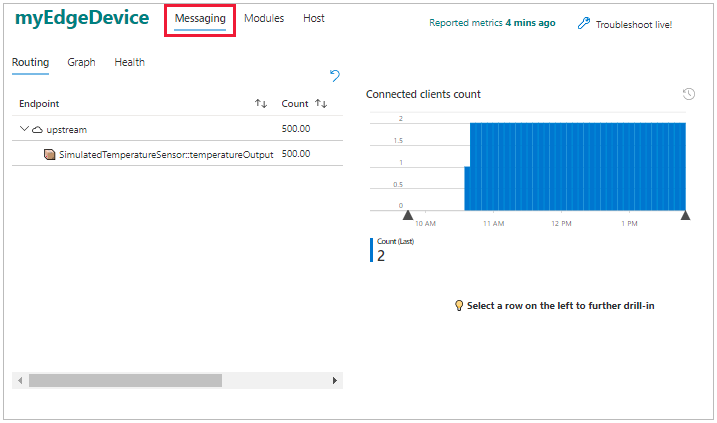
The first page you see in the device details workbook is the messaging view with the routing tab selected.
On the left, a table displays the routes on the device, organized by endpoint. For our device, we see that the upstream endpoint, which is the special term used for routing to IoT Hub, is receiving messages from the temperatureOutput output of the simulated temperature sensor module.
On the right, a graph keeps track of the number of connected clients over time. You can select and drag the graph to change the time range.
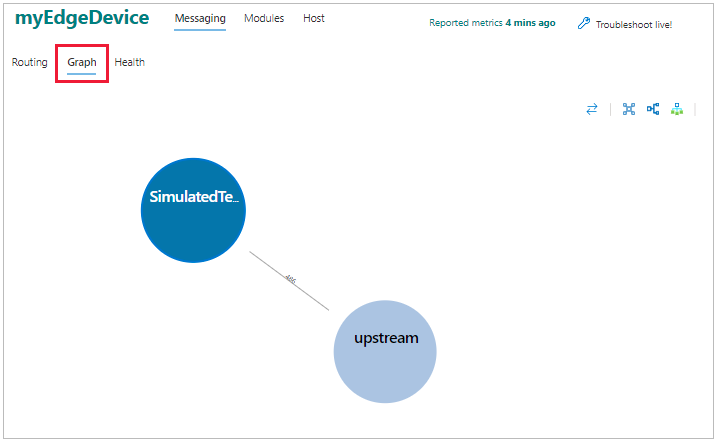
Select the graph tab to see a different visualization of the routes. On the graph page, you can drag and drop the different endpoints to rearrange the graph. This feature is helpful when you have many routes to visualize.
The health tab reports any issues with messaging, like dropped messages or disconnected clients.
Select the modules view to see the status of all the modules deployed on the device. You can select each of the modules to see details about how much CPU and memory they use.
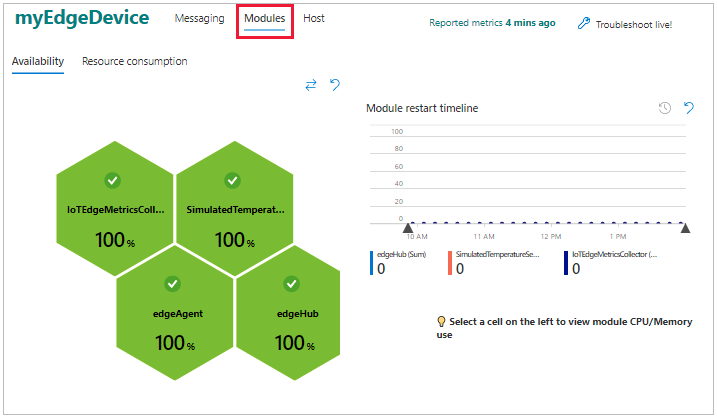
Select the host view to see information about the host device, including its operating system, the IoT Edge daemon version, and resource use.
View module logs
After viewing the metrics for a device, you might want to dive in further and inspect the individual modules. IoT Edge provides troubleshooting support in the Azure portal with a live module log feature.
From the device details workbook, select Troubleshoot live.
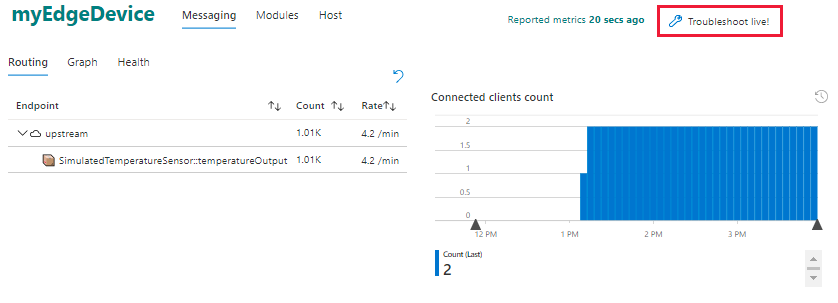
The troubleshooting page opens to the edgeAgent logs from your IoT Edge device. If you selected a specific time range in the device details workbook, that setting is passed through to the troubleshooting page.
Use the dropdown menu to switch to the logs of other modules running on the device. Use the Restart button to restart a module.

The troubleshoot page can also be accessed from an IoT Edge device's details page. For more information, see Troubleshoot IoT Edge devices from the Azure portal.
Next steps
As you continue through the rest of the tutorials, keep the metrics collector module on your devices and return to these workbooks to see how the information changes as you add more complex modules and routing.
Continue to the next tutorial where you set up your developer environment to start deploying custom modules to your devices.