The Java Diagnostic Tool (diag4j) on Azure Kubernetes Service (AKS)
This article provides an overview of the Java Diagnostic Tool (diag4j) on Azure Kubernetes Service (AKS). The diag4j tool is a lightweight, non-intrusive monitoring and diagnostic solution for Java applications running on Azure Kubernetes Service.
Key benefits
The diag4j tool provides the following key benefits:
- Lightweight and non-invasive: by leveraging Spring Boot Admin (SBA) and the Java Attach Agent, the tool is resource-efficient and doesn't require deep modifications to applications.
- Automatic Kubernetes integration: the tool auto-discovers pods with exposed actuator endpoints, listing them on the SBA dashboard.
- Real-time metrics and diagnostics: the tool displays real-time application metrics, garbage-collection (GC) status, and environment variables. You can also adjust log levels dynamically for deeper insights into specific issues.
- Advanced diagnostics: the tool offers enhanced diagnostic features, such as stack trace inspection, viewing local variables, generating heap and thread dumps, and injecting logs dynamically for troubleshooting.
- IDE compatibility: the tool integrates with IDEs to enable debugging without needing to rebuild or redeploy the application, enabling streamlined troubleshooting.
Architecture
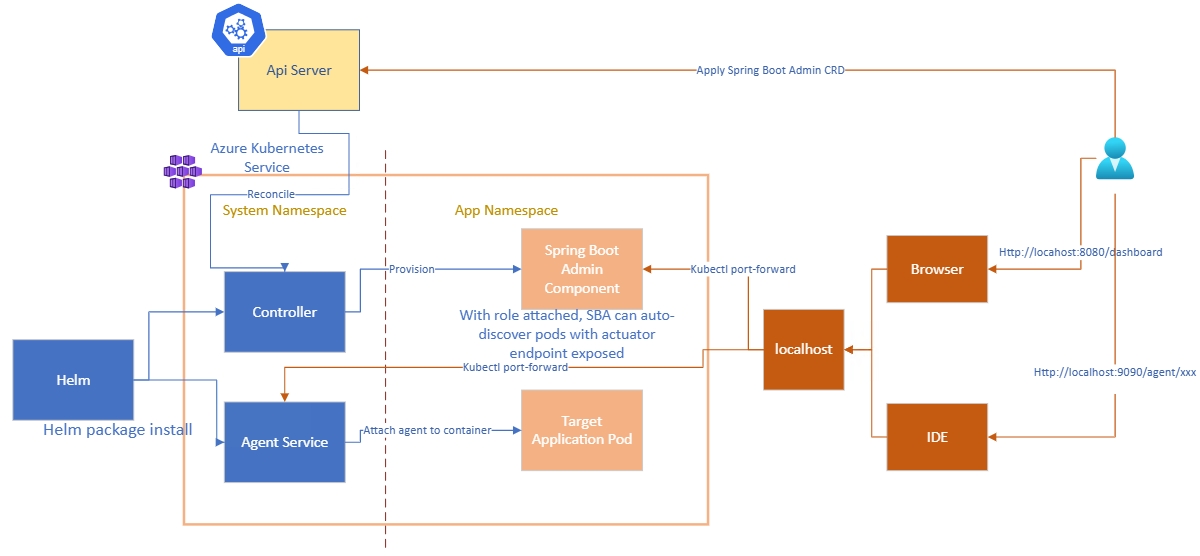
The diag4j tool is composed of the following components:
- The Spring Boot Admin server, which has a read-only role within its namespace to automatically discover and monitor pods exposing actuator endpoints.
- The Java Attach Agent, which is a lightweight Java agent that attaches to running Java processes, enabling diagnostic capabilities without restarting the application.
To maintain security during the current milestone, these components aren't exposed publicly. You can access the tool via the kubectl port-forward command.
