Get started with the Spring Boot Admin component of the Java Diagnostic Tool (diag4j) on Azure Kubernetes Service
This article provides step-by-step instructions to set up and start using the Spring Boot Admin component of the Java Diagnostic Tool (diag4j) on Azure Kubernetes Service (AKS). By following these steps, you can monitor and diagnose your Java applications efficiently.
Prerequisites
- A running AKS cluster with necessary permissions.
- kubectl installed and configured to access your AKS cluster.
- Helm installed on your local machine.
- Java applications deployed in AKS. For more information, see Deploy Spring Boot Application to Azure Kubernetes Service. The tool works better when Spring Boot actuator endpoints are enabled.
- Developer access to the namespace hosting diag4j. Ensure that you can execute
kubectl port-forward.
Install diag4j in your cluster
Use the following command to install diag4j in the desired namespace:
helm install my-diag4j oci://diag4j.azurecr.io/helm/diag4j --version 1.1.5 -n <namespace> --create-namespace
Create a Spring Boot Admin component
Use the following commands to create a Spring Boot Admin (SBA) component:
Apply a custom resource (CR) to create a Spring Boot Admin component. Create a file named spring-boot-admin.yaml, and then add the following contents. Replace
<namespace>with the namespace that your Spring Boot apps are running in. SBA will auto-discover apps whose actuator endpoints are exposed. Others will show with theDOWNstatus on the dashboard.apiVersion: diagtool4j.microsoft.com/v1alpha1 kind: Component metadata: name: spring-boot-admin namespace: <namespace> spec: type: SpringBootAdminUse the following command to apply the CR:
kubectl apply -f spring-boot-admin.yaml
Access the diag4j dashboard
Use the following steps to access the dashboard:
Use the following command to configure local port forwarding to the SBA server:
kubectl port-forward svc/spring-boot-admin-azure-java -n <namespace> 8080:8080Navigate to
http://localhost:8080in your browser to view the SBA dashboard. All applications in the same namespace should be registered automatically.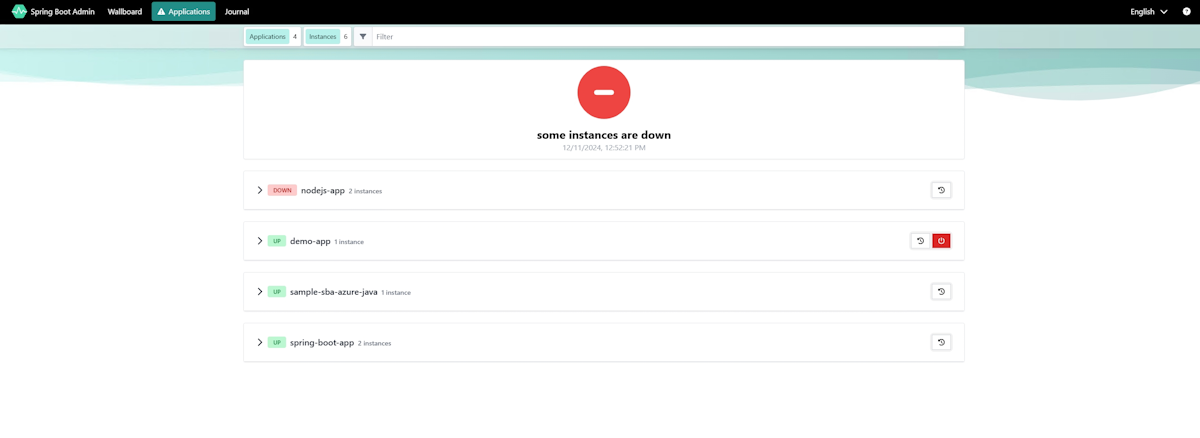

Use the diagnostic features
To view application metrics, click on the application in the SBA dashboard. You can view real-time metrics including the following metrics:
- CPU & memory usage
- Garbage collection (GC) status
- Active threads and environment variables

To adjust log levels, navigate to the Loggers section. You can then modify log levels dynamically for specific packages or classes in order to isolate issues.

To perform advanced diagnostics, generate heap dumps and thread dumps for in-depth analysis.