ArcGIS GeoAnalytics for Microsoft Fabric (Public preview)
Microsoft and Esri have partnered to integrate spatial analytics into Microsoft Fabric. A new ArcGIS GeoAnalytics library is available in Fabric. This library enables spatial analytics in Spark notebooks and Spark Job Definitions for Data Engineering and Data Science. This integration allows Spark developers and data scientists to use Esri's ArcGIS GeoAnalytics functions and tools within Fabric Spark for spatial data transformation and analysis. You don't need any separate installation to use this capability.
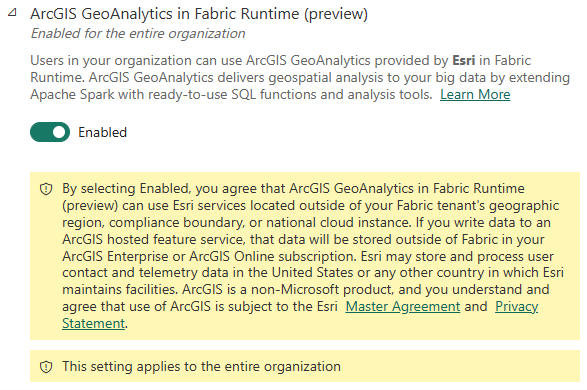
Enable ArcGIS GeoAnalytics
Tenant administrators can enable or disable the ArcGIS GeoAnalytics library in the Fabric Runtime for all users. To do so, sign in to the Fabric portal and navigate to Settings > Admin Portal. In the Tenant settings, enable ArcGIS GeoAnalytics in Fabric Runtime (preview). When disabled, it won't be available in Spark notebooks or Spark job definitions.
Licensing and cost
ArcGIS GeoAnalytics for Microsoft Fabric is free to use during the public preview, with no license required.
Note
ArcGIS is a non-Microsoft product, and you understand and agree that use of ArcGIS is subject to the Esri Master Agreement and Privacy Statement. The current integration is offered and governed under marketplace terms and conditions.
Authentication
The ArcGIS GeoAnalytics library is currently available only in Fabric Runtime 1.3. During the public preview, no authentication is required. The library is preinstalled and preconfigured, so you can import the modules and start using it.
ArcGIS capabilities
ArcGIS provides extensive geospatial capabilities for various applications. Esri is integrating the ArcGIS spatial analytics capabilities into Microsoft Fabric, offering ArcGIS GeoAnalytics functions and tools in the Fabric Spark environment. This integration to help you analyze events, visualize spatial relationships, and gain insights from your data. These capabilities enable the following tasks:
| Task type | Description |
|---|---|
| Access or create spatial data | Access spatial data files saved in OneLake or as feature services in your Esri environment. Convert x and y coordinates into point geometries, or translate between well-defined text and binary representations (For example, well-known text, well-known binary, GeoJSON etc.) into a geometry. See the ArcGIS GeoAnalytics developer documentation for more information on supported data sources. |
| Prepare data | Clean, transform, enrich, extract, and load your data for analysis and modeling tasks. ArcGIS GeoAnalytics provides more than 160 functions for manipulating your spatial data. |
| Enrich data based on location | Add key attributes to your datasets based on shared location or proximity. For instance, add national census-collected sociodemographic data using spatial relationship predicates. This includes identifying if the customer location is inside an area of interest (containment) or within a specified distance. |
| Proximity analysis | Generate insights based on the distance between features, such as the nearest neighbors, all locations within a distance of interest, or create groups of features based on proximity. |
| Analyze movement | Understand patterns across space and time for tracks of moving entities (for example, GPS data tracking vehicle movement), such as calculating motion statistics or finding dwell locations. |
| Identify clusters and hotspots | Find statistically significant groupings within your data according to their attributes and location in space and time. |
| Find similar locations | Identify locations that are similar to one another based on location and attributes, or calculate similarity between line features. |
| Aggregation for business intelligence | Aggregate data and write results back into OneLake for use in Power BI, or schedule your workflows to drive automated updates. |
Usage examples
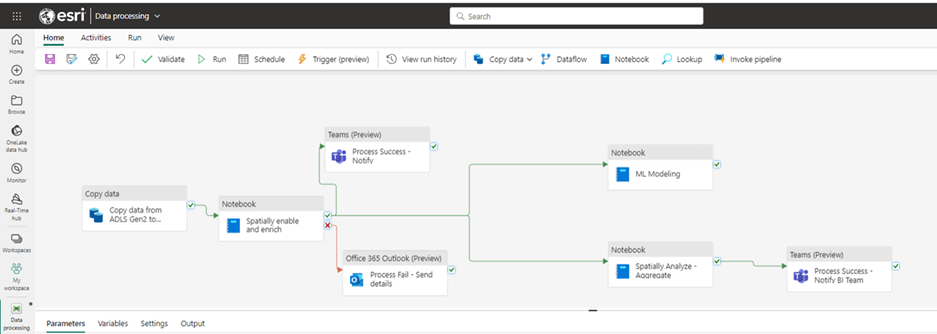
Data engineering and transformations – Automate data cleaning, transformation, and loading using notebooks in Data Science and Data Engineering or pipelines in Data Factory:
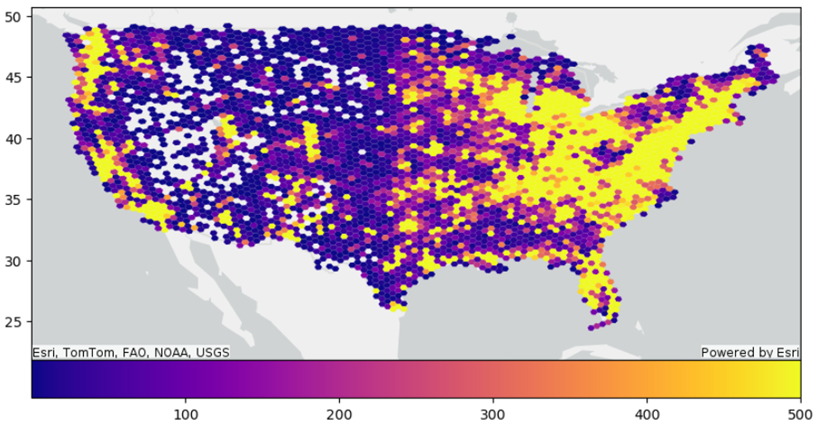
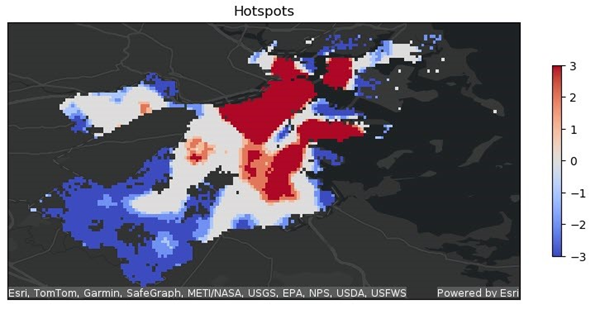
Hotspot and clustering analysis – Identify significant spatial clusters of high (hot spots) and low values (cold spots), spatial outliers, or similar feature groupings:

Spatial pattern identification and analysis – Gain insights into the distribution and patterns of features and data trends across areas or time periods:
Spatial joins for data enrichment and location analytics – Add location-based context based on spatial proximity or proximity across both space and time.
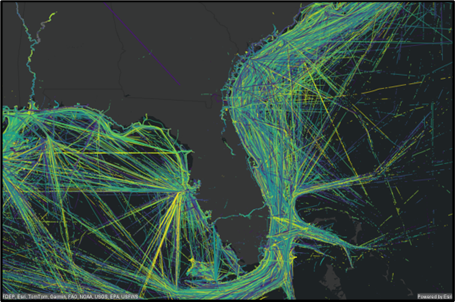
Track and movement analysis – Analyze patterns in GPS or other types of tracking data to detect incidents, calculate motion statistics, and understand change in location over time:
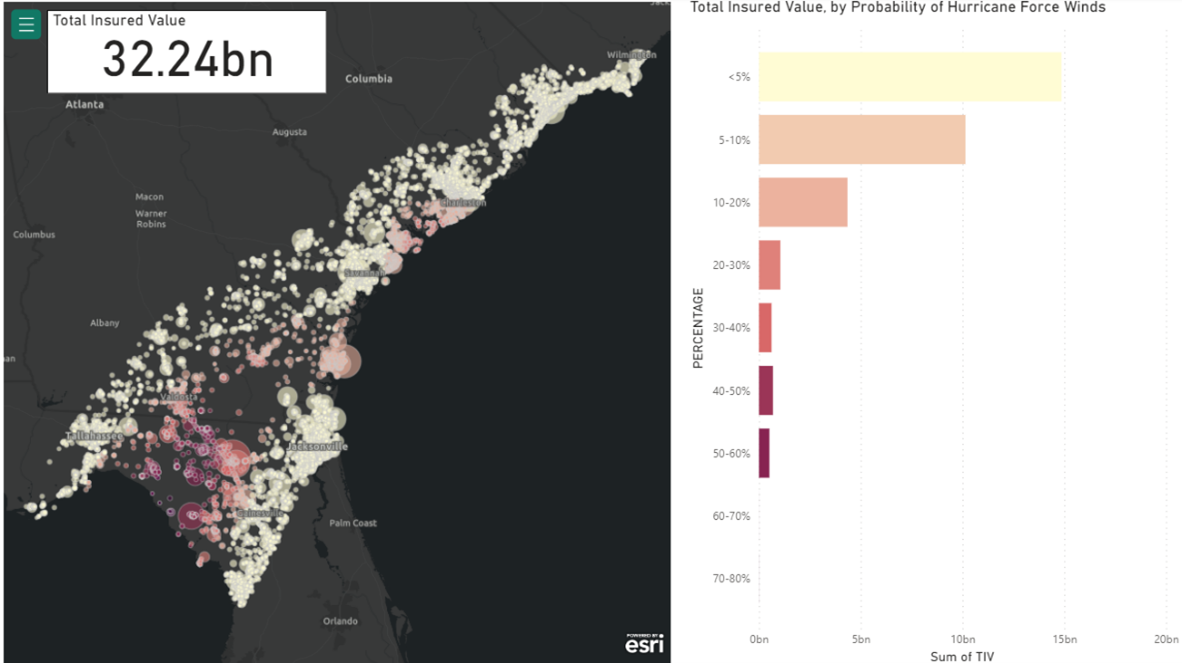
Aggregation and enrichment for use in Power BI dashboards – Write results back into OneLake for use in Power BI. Schedule your workflows to drive automated updates:
For more information on all functions and tools, see ArcGIS GeoAnalytics Developer Documentation.
Beyond ArcGIS GeoAnalytics, you can enhance your spatial data in Fabric using ArcGIS for Power BI. It enables custom data visualization and spatial insights in reports and dashboards.
These capabilities help organizations use geographic context for better decision-making and efficiency. Learn more about Esri’s ArcGIS product suite at the ArcGIS Architecture Center and ArcGIS and Fabric integrations site.
Code templates and examples
You can find code templates and examples in the ArcGIS GeoAnalytics Developer Documentation, the Esri Community for GeoAnalytics for Fabric, and Fabric Data Engineering samples.
Here's an example showing how to do hot spot analysis by importing the FinfHotSopts library and setting the parameters:
# import the Find Hot Spots tool
from geoanalytics_fabric.tools import FindHotSpots

# Use Find Hot Spots to evaluate the data using bins of 0.1 mile size, and compare to a neighborhood of 0.5 mile around each bin
result_service_calls = FindHotSpots() \
            .setBins(bin_size=0.1, bin_size_unit="Miles") \
            .setNeighborhood(distance=0.5, distance_unit="Miles") \
            .run(dataframe=df)
The results can be further analyzed and visualized as shown below:
Get started with spatial data from ArcGIS
The ArcGIS Living Atlas of the World offers various spatial datasets to start working with the ArcGIS GeoAnalytics library. The Living Atlas is the foremost collection of geographic information from around the globe, including data layers that can be used to support your work with ArcGIS GeoAnalytics. Feature services from the Living Atlas can be read into a dataframe using the ArcGIS GeoAnalytics library to enrich your spatial data. For example, you can read data containing geometry and attributes for US States:
# read a feature service hosted in the Living Atlas of the World

myFS="https://services.arcgis.com/P3ePLMYs2RVChkJx/arcgis/rest/services/USA_States_Generalized_Boundaries/FeatureServer/0"

df = spark.read.format('feature-service').load(myFS)
This data is now in a dataframe for use with the ArcGIS GeoAnalytics functions, tools, or with other libraries in your Fabric notebooks. For instance, you could enrich a point dataset with state details using a spatial join relationship (for example, using ST_Contains to identify which state polygon contains each point).
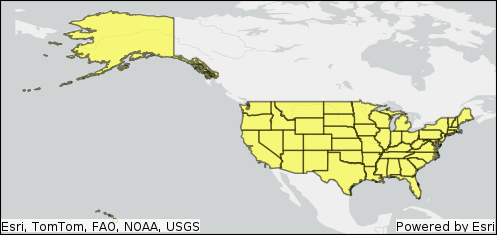
The dataframe can be visualized as a table or used to generate a map with ArcGIS GeoAnalytics.
# plot a dataframe with geometry from a feature service

df.st.plot(basemap="light", geometry="shape", facecolor="yellow", edgecolor="black", alpha=0.5)
Supportability
Support for ArcGIS GeoAnalytics can be found through the Esri Community, and the Developer Documentation.
Current limitations
Currently, this integrated library has the following known limitations:
ArcGIS GeoAnalytics doesn't currently work with Native Execution Engine (NEE)
During the public preview, Scala support is available for ArcGIS GeoAnalytics functions but not tools.
There's read/write support for spatial data as geometries, however, not all output formats support geometry type.
For formats without native geometry support, convert geometries to string or binary types (for example, well-known binary, well-known text, GeoJSON) using functions like ST_AsText and ST_AsBinary.
When writing to Delta, ArcGIS GeoAnalytics converts geometry to a well-known binary format. When reading these Delta tables, check the column type and use functions like ST_GeomFromBinary to convert back to geometry.