Reconcile data with Copilot for Finance (preview)
[This article is prerelease documentation and is subject to change.]
This article describes how to reconcile data by using Microsoft 365 Copilot for Finance.
Data reconciliation in Copilot for Finance simplifies the process of reconciling two data sets in Excel workbooks. You can define the data to reconcile, use AI to determine the reconciliation rules, and benefit from a comprehensive report that provides a generative AI summary of the results of the reconciliation process.
Start working with Copilot for Finance in Excel
To start working with Copilot for Finance in Excel, follow these steps.
Open an Excel workbook that contains the data that you want to compare. Copilot lets you reconcile two data sets that are represented as tables, and that reside in one or two worksheets in Excel.
Go to Home > Copilot for Finance add-in on the ribbon bar to open the Copilot for Finance sidecar.
Note
If you don't see the Copilot for Finance add-in, or if it's unavailable, follow the instructions in Install Copilot for Finance (business user-deployed).
Select data for reconciliation
To start the process and select data for reconciliation, follow these steps.
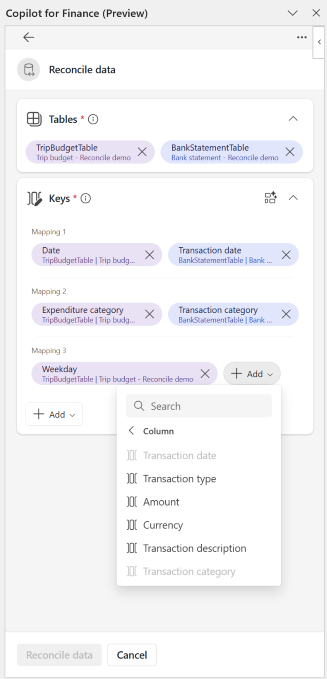
- In the sidecar, select Reconcile data.
- In the table card, Copilot for Finance automatically suggests worksheets and tables to use for the reconciliation process. If the suggested worksheets and tables are correct, proceed to the Define the Reconciliation vectors instructions. If not, remove the suggested worksheet and table by selecting the X next to its name. To add the correct worksheet and table, select Add and choose from the list of worksheets and tables.
Note
The worksheets and table references are populated according to their order in the workbook.
Define the reconciliation vectors
Through AI-aided analysis of the data structures, Copilot for Finance automatically suggests reconciliation vectors by providing mapping and monetary keys, which are displayed in the Keys card.
You can use the Copilot-for-Finance suggested vectors or user-selected vectors.
To define the reconciliation vectors, follow these steps.
Review the Copilot-suggested rules, and utilize one of the three actions:
- Keep – Accept the suggestions that formalize the suggested list and place the vector selection into edit mode. If Keep is selected, more user-selected keys can be added to (or in place of) the list initially presented by Copilot for Finance.
- Regenerate (the circular arrows symbol next to keep) – Rerun the data structure analysis to have Copilot suggest other possible sets of columns.
- Remove all suggestions (delete symbol next to regenerate) – Clear all suggested vectors and begin adding user-selected mapping and monetary keys individually. Alternatively, the Copilot Suggestions button can be selected to instruct Copilot for Finance to generate a list of suggested keys.
In edit mode, select Add to add vectors, and select a type (mapping or monetary key). A pair of parameters, one for each of the two source tables in the reconciliation, is added to the list of keys.
Use the dropdown list to select the columns from the source tables to be used for the key. This process must be done for each of the pairs.
Remove any unwanted columns as you require.
To enable support for a wide variety of use cases, a selection of modifiers is provided for mapping and monetary keys. Learn more in Use partial matching in data reconciliation, Use amount tolerances in data reconciliation, or Match without using a monetary key in data reconciliation.
To start the data reconciliation process after all parameters are defined, select Reconcile data.
Note
Changes to reconciliation parameters can be performed at any time after a reconciliation has been performed. To make changes to the parameters, select the Keys card to expand the view. Edit the mapping keys and select Re-reconcile data,
Reconciliation report
The reconciliation report shows the results of the reconciliation process.
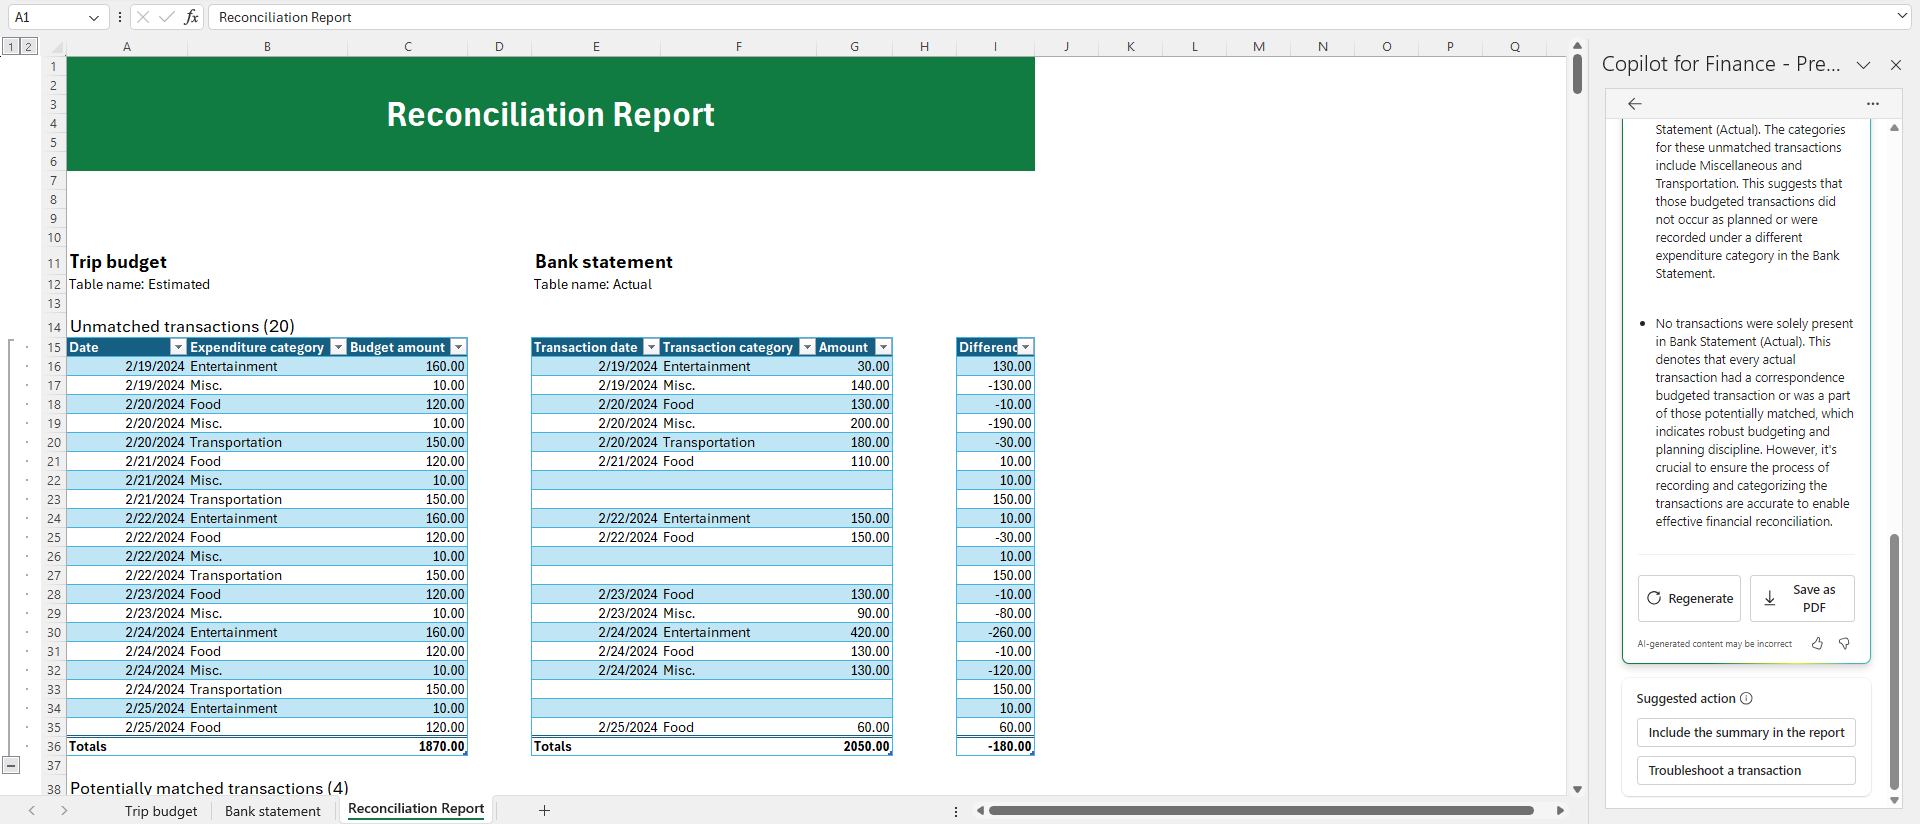
All transactions are compared according to the given parameters and classified into three categories:
Unmatched transactions
- Mapping keys match, but there's a discrepancy in monetary values.
- The transaction doesn't have a corresponding match in the other table.
Potentially matched transactions
- Mapping keys and monetary values are equal, but more than one transaction in one or both data sets sums up to the matched monetary values. All one-to-many (1:n), many-to-one (n:1), and many-to-many (n:m) combinations are shown.
Matched transactions (perfectly matched)
- Values in all selected columns that were given as reconciliation parameters are equal for a single transaction in each table.
Generative AI analyzes the reconciliation results and, based on the transaction types, provides insights and suggestions for addressing inconsistencies in the report summary.
Select Regenerate within the Insights card to rerun the generative AI-driven analyses for the reconciliation report and provide a new summary.
To generate a downloadable PDF version of the summary report, select Save as PDF (down arrow symbol in the upper right corner of the Insights card).
Note
To view a PDF of the reconciliation report on the screen, use the Excel Print to PDF function.
Use suggested actions
After the report summary is generated, you can use a suggested action.
To copy the summary that's available in the sidecar into the body of the report, select Append summary to report.
To get transaction details together with a troubleshooting guide for a single row of a reconciliation report, select Troubleshoot a transaction. In this mode, select the rows for any unmatched or potentially matched transactions on the report to get additional information. Select Back to return to the Report summary page.