System Center 2012 R2 Configuration Manager - Software Update Groups Dashboard
Please review my previous blogs that led up to this dashboard:
I’ve received many requests for a software update compliance dashboard based on Software Update Groups and Collections since not everyone reports compliance based on Operating System or has a whitelist\blacklist of updates.
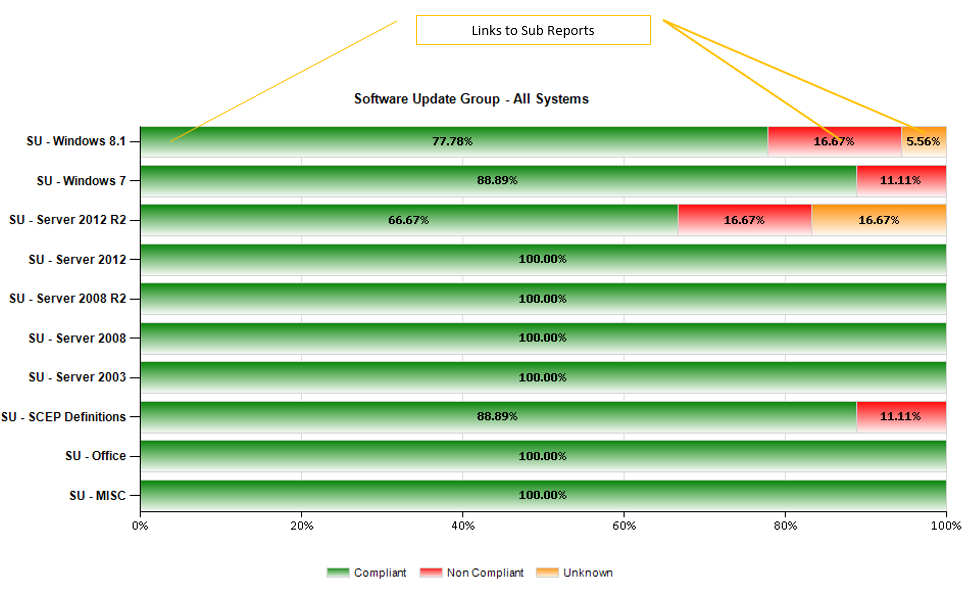
This Software Update Groups Dashboard displays the compliance for each Software Update Groups. The intention of this dashboard is to be displayed on a single screen and able to be printed on a 8” x 11” paper in landscape with no margins. If you have more than 10 SUGs the chart will expand onto the next page.
Breaking down each SUG in a format similar to my previous blog (Month to month, etc) is very time consuming so it’s not included in this version of the dashboard. I do plan on having additional sub reports in the future so stay tuned for those.
Similar to my previous dashboard the top displays the assets. A managed system is defined as a non-obsolete system that has performed a successful scan within a period of time. That time is defined in the @DaysScanned parameter with a default of 14 (days). Feel free to change this. Unlike my previous blog, the chart doesn’t distinguish between an unmanaged or managed system as the queries are using the built in views and the results are based off of a SUG and collection. You are in control of what system and software update to report on.
The bottom half is the SUG compliance chart. It displays the same information that can be found in the console by clicking on a SUG and looking at the bottom right hand corner under Statistics. It will be displayed in a small Pie chart. By default the collection the chart uses is the All System collection. This can be changed by modifying the default value in the CollectionID parameter.
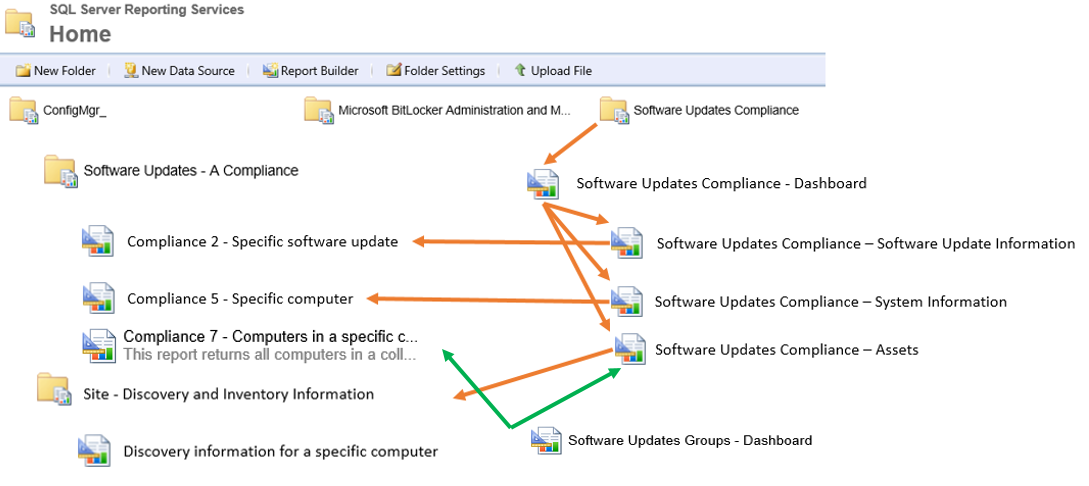
Each Series in the chart is clickable and will open the Compliance 7 - Computers in a specific compliance state for an update group (secondary) report with the parameters prepopulated.
The green arrow indicates the path in which the sub report is linked. The orange arrows show the patch that sub reports are linked from my previous blog.
Attached to this blog is a zip file containing the reports from the Software Updates Compliance dashboard and the Software Update Groups dashboard. Please use the instructions on my Software Updates Compliance blog on how to upload and modify those reports to work.
To install the Software Update Groups dashboard, similar to the previous reports upload the Software Updates Groups - Dashboard.rdl file to the Software Updates Compliance folder . Open theSoftware Updates Groups - Dashboard.rdl with ReportBuilder (or Visual Studio) and change the datasource for your Configuration Manager server.
For each series (Green, Red, and Orange) in the chart, right click it and select Series Properties. Click Action then change the link to the report to include your site code.
Updated on 9-23-2015
- Changed the charts Dynamic Height to =(Count(Fields!Title.Value, "SUG_Status") /2) & " in"
- Changed the Title Property Auto Increment value to 1
- Incremented Version to 1.1
Software Updates Compliance v1.2.2.zip
Comments
- Anonymous
August 21, 2015
Another awsome Dashboard .. very usefull as the first ... Thanks Gary - Anonymous
August 24, 2015
Hi Gary,
Philippe Again. I've tested this new Dashboard version without problem.
Regarding the new SUP Dashboard ... I've 22 Software Update Groups and new page is not created after the first 10 SUG.
This is not a problem for us, but in front of each SUG we can see the name of each one like in your snapshot .. This is not the case for us and we only see 5 SUG Name.
How can I change that in a way to see all SUG Name ?
Thanks again - Anonymous
August 25, 2015
@Philippe
This dashboard is relatively simple and the chart has little modifications to it so there shouldn't be much to troubleshoot.
Would you mind trying to run the query from the dataset in Report Builder? This would help isolate if something in the query or in the report went wonky <-- official term for bad query, typo, etc :)
I'm not sure I understand what you mean by only seeing 5 SUG names. Do you see 10 bars but only 5 have names in front of it? How many characters are in the SUG names that you don't see? Perhaps its a character limitation?
I'll run a couple more tests in my lab to try to mimic your issue. - Anonymous
August 26, 2015
Thanks for your reply Gary.
I've tested all queries from Report Builder without any issues ... No Wonky found.
As I said I have 22 SUG and your dashboard show me 22 Bars (this is good) but only 5 of them have the SUG name in front of it.
Regarding Characters, it's strange.
One of the 5 SUG I can't read is the biggest one : Grp_OutilsSuprLogiciels_Malveillants_x64 .... in opposition this one is not visible : Grp_PatchsAll_Win7_2015.
I have no space character Inside SUG name.
It's weird. - Anonymous
September 15, 2015
@Phillipe
I was finally able to get some time to look at this. To have all the SUG names show the title interval needs to be set to 1. To have the chart automatically grow per SUG, the chart's property DynamicHeight needs to be set to =(Count(Fields!Title.Value, "SUG_Status") /2) & " in"
To change the Title property right click the Title then select Vertical Axis Properties. Change the interval to 1
To change the DynamicHeight property click the entire chart. In the properties pane on the right side (click view then properties if you don't have it up) find the DynamicHeight property and modify it.
I'll update the blog and file shortly. - Anonymous
September 17, 2015
Gary .. you're the king - Anonymous
September 18, 2015
Hi Gary,
SUG dashboard looks awesome!
Is there a way in this dashboard to calculate each SUG based on deployed collection(s) instead of All System? Reason behind this is if Collection=All systems, the report seems not accurate.
Thanks again! - Anonymous
September 23, 2015
@Hoan Le
I believe what you are describing is to report on each SUG for specific collections, most likely the ones they are deployed to. The main reason being that a patch could apply to multiple operating systems but only deployed to a certain subset thus affecting the overall compliance. The .Net patches are a perfect example of this.
This Dashboard represents the compliance information seen in the console if you were to click on “Software Update Groups” so if you want the compliance on a specific collection you’ll need to change the collection parameter.
Technically it is possible but will require a more complex query to figure out where the SUG is being deployed then combine all the results. A simpler but more static approach would be to copy the dataset and hardcode the SUG to collection (or dynamically find it based on deployments) instead of using parameter. Then copy the chart and point it to the new dataset. - Anonymous
September 29, 2015
Thank you for pointing me to the right direction. I was able to map the DeploymentName (NOT SUG) to Target Collection.
Thanks again for your help! - Anonymous
October 15, 2015
This is awesome stuff Gary really appreciated, Have you considered a similar dashboard to this but reversed in that you specify a SUG and then it shows the compliance versus a list of collections that are picked up by the collection naming convention. To explain why, where I am currently, managing the updates process we facilitate as IS the patching of server clients via SCCM but the responsibility for achieving and maintaining compliance is down to the business units that own the servers. So we have via various and diverse means come up with a list of collections named after those business units using a naming convention that starts "SU-RPT" and the servers are categorised appropriately into the relevant owners collection. Management want to see the overall compliance for all the BUs on one report so they can see if any of them are lagging behind the others... similar in look to this dashboard but multi collections showing against a single selected SUG, however my SRSS reporting skills fall woefully short and so far I have not come up with something adequate. - Anonymous
October 20, 2015
Man these reports are simply amazing! I had a few issues importing them just because I am running them on SQL Server 2008. Maybe because I am on SQL Server 2008, I'm also having some issues making them look nice when printing them out or exporting to PDF. The page breaks are all weird and when exporting to PDF, I can't make it landscape. Is that just because I am on SSRS 2008? - Anonymous
December 02, 2015
Hi gary, I added the files and they are pointing to the correct data source. However, when I run the query, i get no errors but also get no results? what am I doing wrong? - Anonymous
December 08, 2015
Hi Gary,
All of the reports are absolutely stunning, and hte ywork like a charm.
I am running in to a problem with the amount of SUG we have and i was wondering if there is a way to add a parameter for SUG ?
Thank you in advance! - Anonymous
February 15, 2016
Awesome job Gary, excellent reports/dashboards. I have a little issue with Server Missing Software Updates, when I select it I get the following error "An attempt was made to set a report parameter 'RequiredUpdates' that is not defined in this report. (rsUnknownReportParameter) ". I tried to manually set "Software Updates Compliance - Software Update Information" on the Action - Specify a report field, but no luck. What am I missing here ? - Anonymous
February 18, 2016
I have similar problem like RBogdan - we have huga amount of SUG's - so Raport gets unreadable. I wast able to distribute raport over several pages. So i eddited Chart data properties. Chart data - Category Groups - Title , Filters - Title like Reporting* , shows me only raport for SUG starting with "Reporting". - Anonymous
February 18, 2016
Sorry - Niko, not RBogdan


