Creating a Custom Report for System Center 2012 R2 Configuration Manager - Part 1
This blog is intended to demonstrate how to create a dashboard for System Center 2012 R2 Configuration Manager using SQL 2012 Reporting Services and Report Builder 3.0.
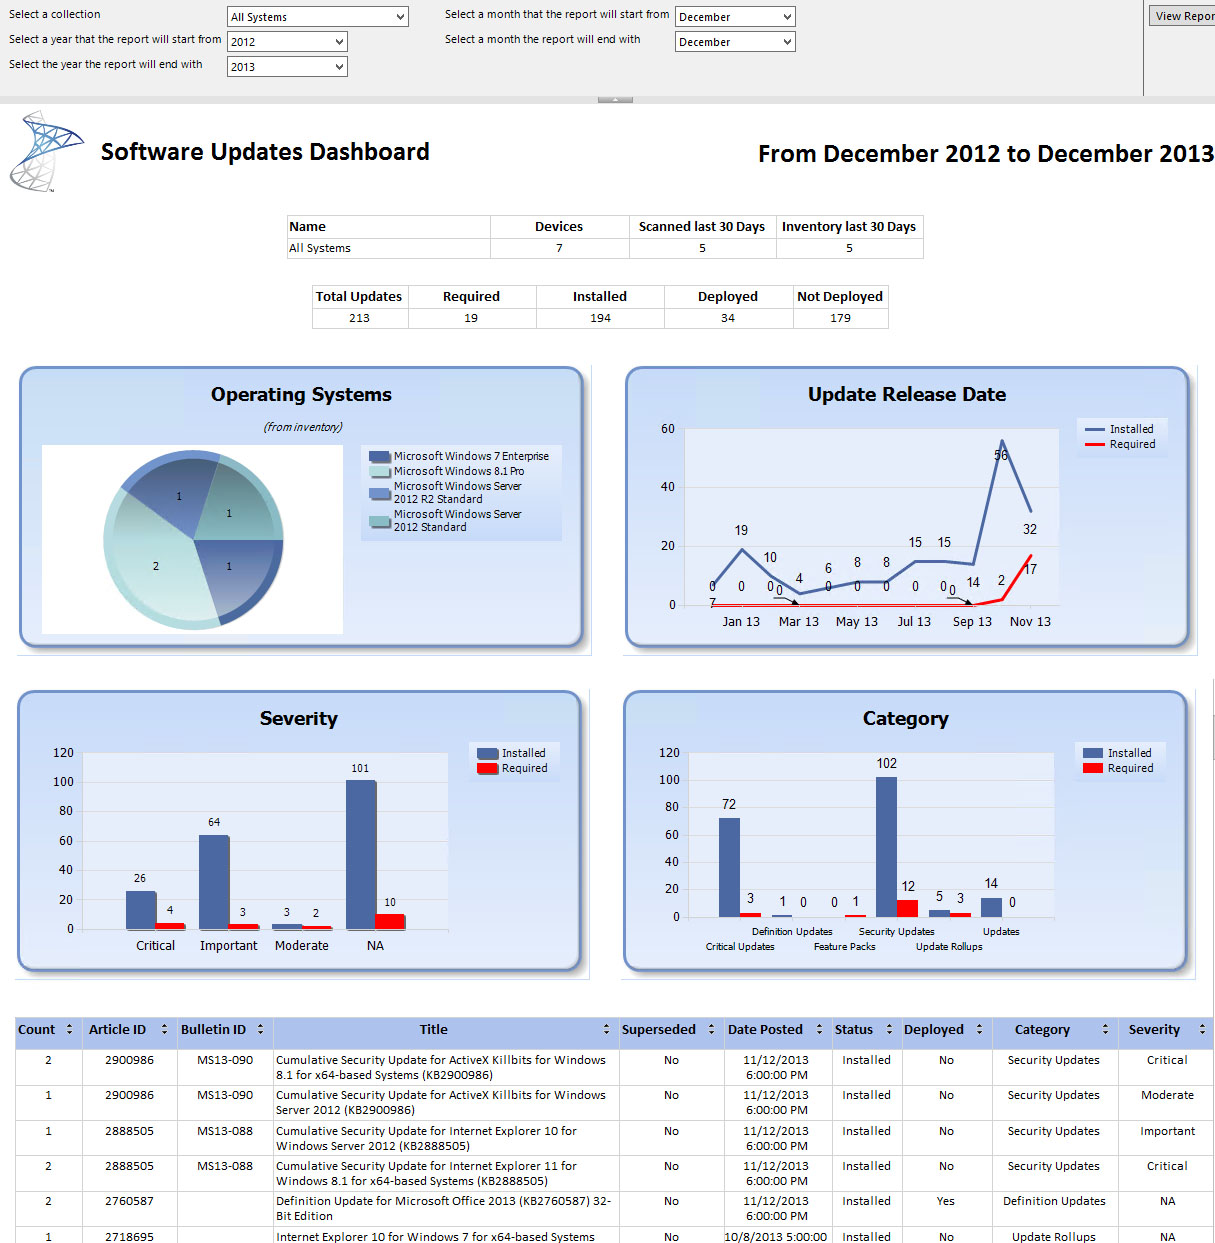
For a practical demonstration, a dashboard for software updates will be created that uses tables, a pie chart, a line chart, and a column chart.
The built in reports for software updates contain a large quantity of information however, there isn’t a dashboard to provide a quick overview of update status. In its given state, you would have to drill down into multiple reports, export the data, and then manipulate it in a spreadsheet to present it in a dashboard form. It is possible to run SQL queries from within Excel or PowerPoint to display a dashboard but that’s beyond the scope of this blog.
Since there are so many different angles to display software update statuses, this dashboard will contain a query that will display data based on the v_Update_ComplianceStatusReported view. This view contains the status of each software update for each system that has successfully performed a scan. It is important to note this as if you want a query based off a list of updates (software update groups) or a success rate to include inactive systems then this dashboard won’t work for you although you could use the examples and create your own dashboard.
The v_Update_ComplianceStatusReported view contains a column called “Status” to indicate if an update is Installed, Required, or Not Applicable. Since we are only concerned about installed or required updates, the not applicable status will be filtered out and significantly reduce the number of data queried on.
The dashboard will allow filtering by collection and a duration (a start date and an end date) to display the following:
- A table with the collection name, number of devices, number of devices that performed a software update scan in the last 30 days, number of systems that performed a hardware inventory in the last 30 days
- A table that displays each required or installed update with the number of applicable systems, the article ID, the Bulletin ID, the Title, whether it is superseded, the Date the update was posted, whether it is deployed or not, the category, and the severity of the update.
- A Pie chart that displays each inventoried operating system
- A Line chart that displays the number of required and installed updates by month (or every couple months to fit in the graph)
- A table with the total number of updates, the count or required updates, the count of installed updates, the count of deployed updates, and the count of updates not deployed
- A Column chart that displays the number of updates installed or required by severity
- A Column chart that displays the number of updates installed or required by category
This screenshot is what the dashboard will look like
Creating a Custom Report for System Center 2012 R2 Configuration Manager – Part 1
Creating a Custom Report for System Center 2012 R2 Configuration Manager – Part 2
Creating a Custom Report for System Center 2012 R2 Configuration Manager – Part 3
Creating a Custom Report for System Center 2012 R2 Configuration Manager – Part 4
Creating a Custom Report for System Center 2012 R2 Configuration Manager – Part 5
Comments
- Anonymous
November 27, 2014
hi there, youre picture of your dashboard is nog available :( - Anonymous
May 27, 2015
Gary,
I appreciate you posting this information. Great job!
