Plan a deployment of Office Telemetry Dashboard
Applies to: Office 2019, Office 2016
Important
- Office Telemetry Dashboard is no longer supported in Microsoft 365 Apps for enterprise (as of Version 2208), and is removed in Version 2301 (and later).
- For more information, see Removal of Office Telemetry Dashboard from Microsoft 365 Apps for enterprise.
When you deploy Office Telemetry Dashboard, you must consider several factors. These can include the location of the users to be monitored and the hardware specifications of the computer that runs the processor and other components that deliver the data to Office Telemetry Dashboard. It's also important to understand the supported limits for Office Telemetry Dashboard deployments, such as the maximum number of users who can be monitored. Use the guidance in this article to help you design an Office Telemetry Dashboard topology that is sized appropriately for your organization.
Introducing Office Telemetry Dashboard
Office Telemetry Dashboard is an Excel workbook that displays compatibility and inventory, usage, and health data about the Office files, Office add-ins, and Office solutions that are used in an organization. For a visual representation of the components used to support Office Telemetry Dashboard and how they work, download this poster, which includes a description of all components, a list of what Office files are monitored, how data collection works, and more. Although the poster is for an earlier version of Office, the information also applies to newer versions of Office.
Important
- Office Telemetry Dashboard is an on-premises tool that collects inventory, usage, and health data about the Office documents and solutions, such as add-ins, used in your organization. The data is primarily designed to help your organization with application compatibility testing.
- Data collected for Office Telemetry Dashboard is stored in a SQL Server database controlled by your organization and the data collected is not sent to Microsoft. For more information, see Data collected by the agent for Office Telemetry Dashboard.
- Data collected for Office Telemetry Dashboard is different than Office diagnostic data, which can be sent to Microsoft. For more information about Office diagnostic data, see Overview of privacy controls for Microsoft 365 Apps.
- Settings used to manage Office Telemetry Dashboard have no impact on Office diagnostic data and vice versa. For more information about managing Office diagnostic data, see Use policy settings to manage privacy controls for Microsoft 365 Apps.
Before you begin planning an Office Telemetry Dashboard deployment
Ensure that you have reviewed the content in Assess Office compatibility. This article introduces you to the compatibility process you use with Office Telemetry Dashboard to gather data for Office deployment.
As you review this article, be aware that the recommendations assume that the following statements are true for your organization:
Agents upload data every 8 hours, which is the default setting.
Each user has a single computer that runs an agent.
If these statements are not true for your organization, plan to adjust your topology accordingly.
Office Telemetry Dashboard components
The following table describes the tools and components for Office Telemetry Dashboard:
| Tool | Description |
|---|---|
|
|
Office Telemetry Dashboard: - Shows IT Pros a combined view of inventory, usage, and health data - Is installed with Office Professional Plus 2019, Office Professional Plus 2016, or Office Standard 2016. - Requires Excel installed from Office 2019 or Office 2016. - Connects to the database - Can be viewed by multiple IT Pros |
|
|
Office Telemetry Log: - Helps developers and experienced users diagnose compatibility issues that occur on an Office client - Is installed with Office Professional Plus 2019, Office Professional Plus 2016, or Office Standard 2016. - Requires Excel installed from Office 2019 or Office 2016. - Connects to the local data store on the client computer |
The following table describes the components of Office Telemetry Dashboard. The first two components shown below are required for both Office Telemetry Log and Office Telemetry Dashboard. The remaining components that are listed are applicable only to Office Telemetry Dashboard. These components collect data from across an organization so that you can view it by using Office Telemetry Dashboard. To learn how to deploy these components, see Deploy Office Telemetry Dashboard.
| Component | Description |
|---|---|
|
|
Office Telemetry Log: - Monitors events for (and is built into) Office 2019 and Office 2016 versions of Word, Excel, PowerPoint, and Outlook. - Is disabled by default. - Is enabled by using Group Policy, registry settings, or by selecting the Enable Logging button in Office Telemetry Log. - The resulting data can be viewed on the local computer by using Office Telemetry Log. |
|
|
Office Telemetry Agent: - Reports usage and inventory data for all Office clients. - Reports application event data for Office clients. - Must be deployed to Office 2003, Office 2007, and Office 2010 clients. (These versions of Office are no longer supported.) - Is built into Office 2019 and Office 2016 clients. - Must be enabled using Group Policy or the registry. - Runs as a scheduled task. - Requires domain membership. - Periodically uploads data to a shared folder. - Requires the latest version of the Universal C Runtime (CRT). For more information, see Update for Universal C Runtime in Windows. |
|
|
Group Policy settings: - Enable and configure the agent on each client. - Are part of Office16.admx and Office16.adml. - Are located under User Configuration\Policies\Administrative Templates\Microsoft Office 2016\Telemetry Dashboard. - Can be downloaded from the Microsoft Download Center. |
|
|
Shared folder: - Stores data that is uploaded by agents. - Must be on premises (no cloud support). - Can be located on the same computer as other components. - Is configured when you install the processor. |
|
|
Office Telemetry Processor: - Uploads data from the shared folder to the database. - Runs as a Windows service named "Office Telemetry Processor." - Is supported on Windows Server 2012 and later versions. - Can be run on Windows 10 or Windows 11 in test or small environments. - Can be run on the same computer as other components. - Can be installed on multiple computers for large deployments. - Requires domain membership unless a workaround is used. - Requires the latest version of the Universal C Runtime (CRT). For more information, see Update for Universal C Runtime in Windows. - Supports Transport Layer Security (TLS) 1.2 |
|
|
Database: - Provides a data source for Office Telemetry Dashboard. - Requires SQL Server 2005, SQL Server 2008, SQL Server 2008 R2, SQL Server 2012, SQL Server 2014, or SQL Server 2016. - Can be run on SQL Express editions in test or small environments. - Can be run on the same computer as other components. To check which versions of SQL Server are currently supported, go to Search Product and Services Lifecycle Information. |
How data is collected
The following table describes and illustrates how data collection is triggered and the flow of data between the agents and Office Telemetry Dashboard. You can view a more detailed diagram in this downloadable poster. Although the poster is for an earlier version of Office, the information also applies to newer versions of Office.
Steps in the data collection process
| Step | Description |
|---|---|
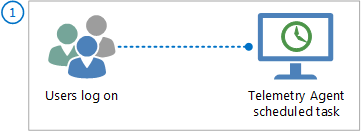
Users log on and trigger the agent scheduled task
|
Users log on and trigger the scheduled task that uploads data. The agent waits 10 minutes for logon processes to complete, and then the agent waits for a random number of minutes, up to 4 hours, before it starts the upload process. After the initial upload, the agent uploads data every 8 hours. Mobile or offline clients upload data when users log on when the connection is restored. To learn how to configure the upload interval for agents, see Enabling and configuring the agent. |
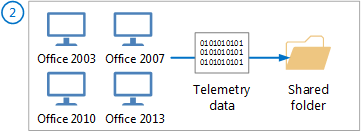
Agents send data to the shared folder
|
In this image, agents for all versions of Office collect the following data to upload to the shared folder: - Most recently used documents - Registered add-ins - System and user information Agents for Office 2019 and Office 2016 also collect the following data for certain Office applications: - Application events - Add-in performance Here are the approximate data upload sizes (in KB) for agents. These sizes can vary. - Office 2003, Office 2007, and Office 2010: 50 KB per upload - Office 2013 or later: 64 KB per upload To learn more about the kinds of data that are uploaded and how to manage user privacy for this data, see Manage the privacy of data monitored by Office Telemetry Dashboard. |
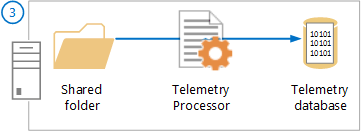
Data is processed to the database
|
After the agents upload data to the shared folder, the processor imports the data to the database. The shared folder, the processor, and database can run on the same computer or on different computers. |
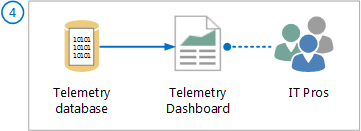
IT Pros access data by using Office Telemetry Dashboard
|
IT Pros who are granted permissions to the database can use Office Telemetry Dashboard to view the combined data. To learn more, see To grant other administrators permission to access the database. |
Planning labels for agents
The agent collects inventory, usage, and health data and uploads it to a shared folder. To help you filter and organize this data when it is displayed in Office Telemetry Dashboard, you can assign up to four custom labels for each agent to describe the client computer's physical location, the user's business group, user role, or other identifier. This helps you analyze data for specific business groups, types of users, or any other designation that you choose. Use the following resources to help you plan the labels that you want to use before you deploy and enable the agents:
Deploying labels (tags) for better analysis in Office Telemetry Dashboard describes how labels appear in Office Telemetry Dashboard. The blog post also describes three methods for populating the labels. For Office 2019 and Office 2016, use Group Policy and set labels based on your Active Directory structure. The scripts mentioned in the blog, Create-GroupPolicyObjectForTags.ps1 and Add-Tags.vbs, do not work with Office 2019 and Office 2016.
The "Custom reporting in Office Telemetry Dashboard" video demonstrates how labels are used in custom reports. This may give you some additional ideas on which labels to choose.
Although this video is for an earlier version of Office, the information also applies to newer versions of Office.
Topology requirements for Office Telemetry Dashboard deployments
At a minimum, Office Telemetry Dashboard requires one database and one processor and shared folder pair. These can be hosted on the same computer, as shown in the following figure. You can use the computer for other purposes besides hosting Office Telemetry Dashboard components.
Minimum topology requirements for Office Telemetry Dashboard
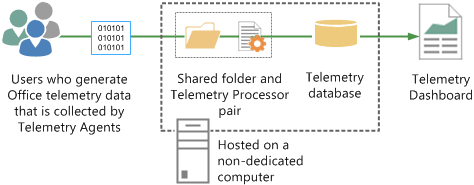
Two additional requirements apply to the processor and shared folder pairs:
A processor must always have a dedicated shared folder. A shared folder can't be used by multiple processors.
You can have multiple processors and shared folder pairs, but each pair must be stored on a separate computer. The next section, Supported limits for Office Telemetry Dashboard components, describes the numbers of pairs that you can create in an Office Telemetry Dashboard topology.
Supported limits for Office Telemetry Dashboard components
For best performance, we recommend that your Office Telemetry Dashboard topology does not exceed the limits that are described in the following table.
Supported limits for Office Telemetry Dashboard components
| Supported limits for a database | Supported limits for each processor and shared folder pair |
|---|---|
| - Host data for up to 100,000 users. - Host up to ten processor and shared folder pairs. - Host up to 30 users of Office Telemetry Dashboard. Hosting of more than 30 users is supported but, when multiple users try to connect to the database at the same time, database performance may decrease temporarily. |
Process data for up to 50,000 users. |
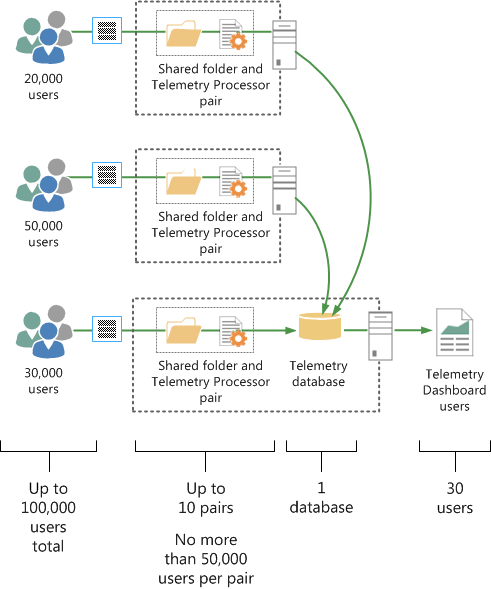
Here is a figure that shows a production topology that is configured within the supported limits. Each processor and shared folder pair has fewer than 50,000 users and this topology already has the maximum of 100,000 users for the database. Three computers host components in this example.
Production topology for Office Telemetry Dashboard
Topology and bandwidth recommendations for Office Telemetry Dashboard deployments
If your organization has users who are in multiple geographic locations, make sure that you follow these guidelines when you decide where you want to deploy the Office Telemetry Dashboard components.
We recommend that you host the Office Telemetry Dashboard components (the dashboard, database, processor, shared folder, and agents) on a network that has bandwidth of 1.5 Mbps (T1) or more, with latencies no greater than 150 ms.
Deploy each processor and shared folder pair as close as possible, ideally on the same computer.
If you only need one processor and shared folder pair, run the database, processor, and shared folder on the same computer to avoid any bottlenecks that are caused by transferring data over the network.
If you must have multiple processor and shared folder pairs, run one processor on the same computer as the database. Run other processors on separate computers.
For a database that hosts more than 10,000 users, consider the following recommendations, in addition to general performance recommendations for SQL Server:
For the best performance, deploy SQL Server on a dedicated computer that is not hosting databases for any other application.
For the best performance, place the tempdb, database, and SQL transaction logs on separate physical hard disks.
Ensure that the SQL I/O channels to the disks are not shared by other applications, such as the paging file and Internet Information Services (IIS) logs.
Scaling out Office Telemetry Dashboard deployments
We recommend that you start with a single dedicated computer that is running the database, processor and shared folder pair, and then scale out the topology by adding more computers that host processor and shared folder pairs. We recommend that you add a new processor and shared folder pair if you do either of the following:
Collect data from more than 50,000 users.
Collect data from remote sites. We recommend that you install the processor and shared folder pair as close to the agents on the client computers as possible.
Hardware recommendations for Office Telemetry Dashboard deployments
The following table describes hardware recommendations for Office Telemetry Dashboard deployments.
Hardware recommendations for the computer that hosts the database
| Monitored users and monitored duration | RAM | Disk space | Processor |
|---|---|---|---|
| 100 users for 3 months (evaluation) |
4 GB** |
81 MB |
1 Ghz or faster |
| 10,000 users for 1 year |
8 GB** |
14 GB |
2 GHz or faster |
| 100,000 users for 1 year |
32 GB** |
107 GB |
2 GHz or faster |
*Includes inventory and events for earlier versions of Office and for Office 2019 and Office 2016.
**The recommended RAM value is greater than the one recommended as the minimum values for SQL Server because of the distribution of data required for an Office Telemetry Dashboard environment.
The following table describes hardware recommendations for each computer that hosts a processor and shared folder pair.
Hardware recommendations for each computer that hosts a processor and shared folder pair
| Monitored users and monitored duration | RAM | Disk space | Processor |
|---|---|---|---|
| Any |
4 GB |
11 GB |
1 Ghz or faster |
*Includes inventory and events for both earlier versions of Office and for Office 2019 and Office 2016.