Working With Operations
Message Analyzer provides some special features for working with protocols that employ request and response messages as the basis of their negotiation architecture. In other protocol analysis tools, it is a common practice to display messages in the order in which the tool originally captured them. In practice, this can present some difficulties for those who are analyzing such data, because they may have to search through literally hundreds, if not thousands of messages to locate the response to an associated request message. Although other techniques such as filtering can be used by the analyst to find these messages, it can still involve multiple steps of additional manual configuration to locate and organize the data before analysis can begin.
Message Analyzer provides a simple solution to this problem by encapsulating each request and response message pair of any protocol that uses this architecture into a single, expandable Operation node that displays as a top-level message row in the Analysis Grid viewer. By expanding such an Operation node, you can expose the original request and response messages, where each of these messages also has an expandable node that encapsulates an associated message stack. This technique pushes all the information of importance in this scenario to top-level for quick and efficient analysis. Moreover, because the response message is at top-level, you don't have to search any further to begin analyzing the data. Note that the Operations feature aligns with the overall Message Analyzer design strategy to bring relevant data that is normally hidden or dispersed to the top-level of a suitable analysis surface, where you can examine it immediately without the encumbrance of having to apply elaborate techniques to get at the data you need to assess.
Note
Some typical protocols that support request/response message pairs include HTTP, DNS, and SMB2. The messages for these protocols and others that support Operations will appear in the Analysis Grid viewer as Operation nodes, where they are signified by a blue-cubed icon.
Advantages of Operations to Analysis
The major advantage of having request/response pairs encapsulated into separate Operations nodes is that this configuration provides quick access to both the request and response messages when you expand an Operation node. You can also expose the server response time to requests that Message Analyzer automatically calculates for you, as described in the list that follows. With this information exposed at top-level in the Analysis Grid viewer, you can quickly make comparisons between several important values that can be critical to troubleshooting and analysis. These values consist of the following:
ResponseTime — provides an indication of how long it took to receive a server's first response to a request message. Large values for ResponseTime can be an indication of a slow server that is having performance problems.
You can view this value by adding ResponseTime as a new column in the Analysis Grid viewer from the Global Annotations node of the Field Chooser Tool Window. Under this node, locate the ResponseTime annotation, right-click it, and then select the Add As Column command in the context menu that appears. Thereafter, you can see at-a-glance the server ResponseTime that is associated with the request and response messages that are encapsulated by any Operation node in the Analysis Grid viewer.
TimeElapsed — provides an indication of total elapsed time for an Operation that includes how long it took to receive a server's first response to a request message plus the amount of time it took to receive all fragments associated with the transaction. Large values for TimeElapsed can be an indication of network latency issues, particularly if the ResponseTime values are comparatively low.
You can view TimeElapsed values in the Analysis Grid, as it is a column in the default layout for this viewer.
Tip
If you are working with HTTP Operations, you can open a Chart with the Average Response Times for Operations view Layout against a set of trace results to review a summary of average Response Time values for HTTP methods. To open a Chart with the specified Layout, click the New Viewer drop-down list on the global Message Analyzer toolbar, highlight Chart, and then select the Average Response Times for Operations layout.
More Information
To learn more about the Response Time, as used in the Average Response Times for Operations view Layout, see the Average Response Time for Operations topic.
Disabling Operations
When you capture messages that are part of an Operation, the Message Analyzer parsing process normally identifies and collapses this traffic to combine related request and response message pairs into a single, top-level message row as previously indicated. To indicate an Operation in the Analysis Grid viewer, Message Analyzer designates this row with a blue-cubed icon in the MessageNumber column and provides an expansion node next to this icon that opens the request and response message pair that makes up the Operation. However, for viewing preferences and because on occasion it might be advantageous to display the original chronological context in which response messages occurred, Message Analyzer enables you to create this display configuration by selecting the Disable Operations item from the Viewpoints drop-down list on the Filtering Toolbar. To return to the default message display in the Analysis Grid viewer with Operation nodes intact, you can simply select the No Viewpoint item from this same list.
The default configuration for message lines in the Analysis Grid viewer is to show all top-level message nodes in a set of trace results, which includes Operation nodes that encapsulate request/response pairs for protocols with this type of architecture, along with all other top-level message nodes that are not Operations, both of which have nested expansion controls to expose the underlying encapsulated message stacks. This display configuration is shown in the following figure.
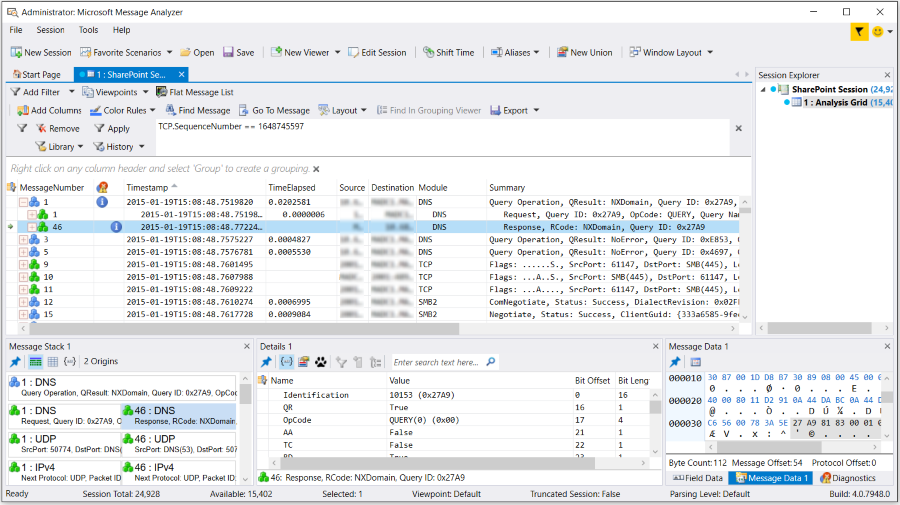
Figure 55: Operations enabled and showing expanded node exposing DNS request/response messages
The figure shows the default view whenever you have Disable Operations unselected in the Viewpoints drop-down list. For example, the DNS request and response messages #1 and #46, respectively, are encapsulated in an Operation node that is denoted by a blue-cubed icon, and is currently shown in the expanded state. When you select Disable Operations in this list, Operation messages are released from their default encapsulated configuration and the constituent request and response messages are broken out and reorganized into top-level messages in their original chronological capture sequence along with all other top-level, non-operation messages in your trace results, as shown in the figure that follows. Note that all top-level messages of the non-operation type are designated by a green-cubed icon.
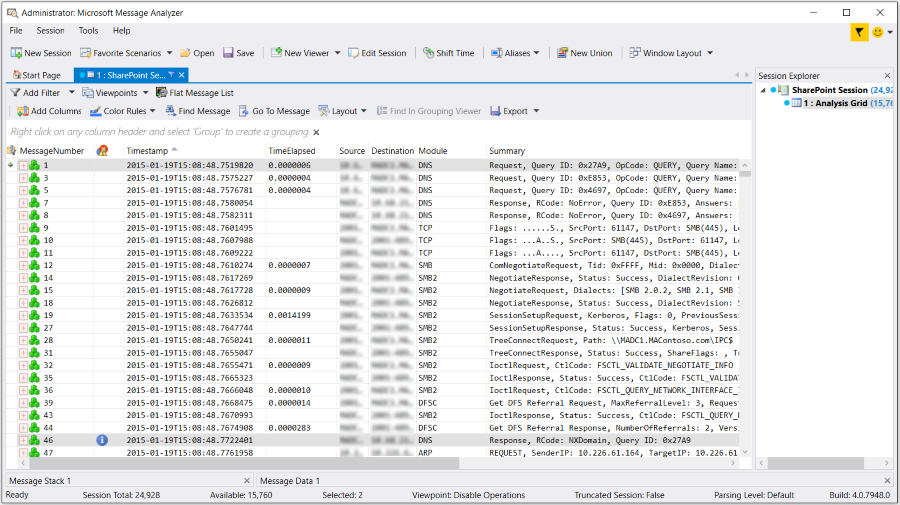
Figure 56: Operations disabled and showing original message sequence
In this figure, note that the formerly encapsulated request message #1 and the response message #46 now display in their original capture sequence.
Note
When you Disable Operations, Message Analyzer reparses all messages in the Message Store (a repository for the original set of captured but unparsed messages) without encapsulating the request and response message pairs under Operation nodes.
Operations and Filtering Interactions
A situation where you might need to disable Operations is when you want to apply a view Filter that isolates a request message type or a response message type from a particular protocol that uses this architecture, such as SMB2. When request and response message pairs are encapsulated under an Operation node, a view Filter will be unable to separate them so that you can view them as standalone messages of either type. For example, if you created and applied a Filter such as SMB2.NegotiateRequest, you will return the SMB2 request messages within the context of the Operation nodes only, rather than as standalone messages as you might typically expect.
The only way that you can isolate these messages is to apply a Viewpoint Filter after you have broken the request and response message pairs apart with the Disable Operations Viewpoint. Thereafter, you should be able to see the isolated SMB2 request messages, as described in the steps below:
Through a Data Retrieval Session, import a message collection that includes SMB2 messages.
The messages should have been captured while performing some SMB2 file share access operations.
Ensure that No Viewpoint is currently selected in the Viewpoints drop-down list.
Type the filter code
SMB2.NegotiateRequestin the text box of the Filter panel on the Filtering Toolbar.Click the Apply button on the Filtering Toolbar and note that the results display SMB2 Operation nodes rather than separate request messages, as shown in the figure that follows.
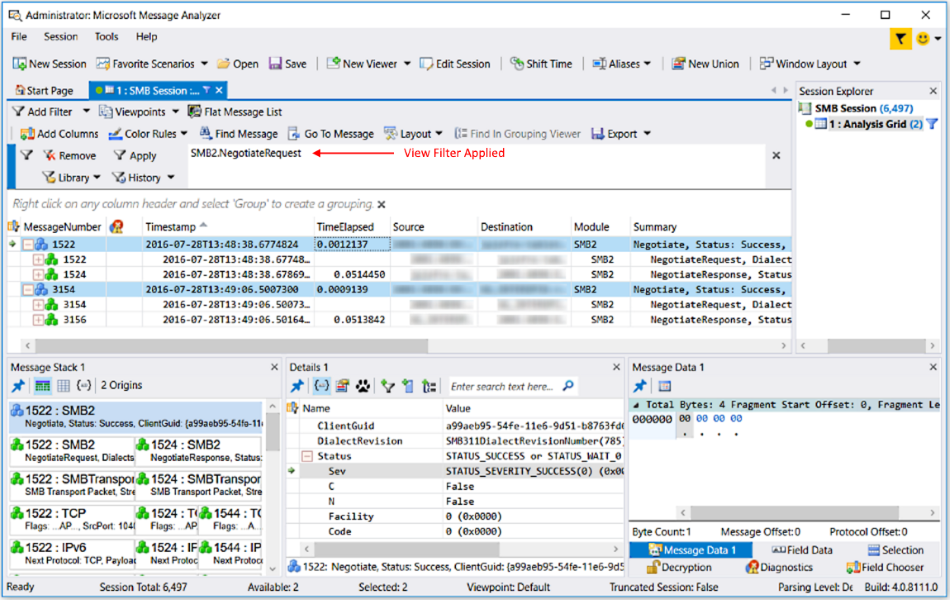
Figure 57: View Filter fails to isolate SMB2 request messages
Select the Disable Operations item in the Viewpoints drop-down list to disable all Operations.
Note that both SMB2 request and response messages continue to display, given that the effect of the view Filter is still in play here, as shown in the figure that follows.
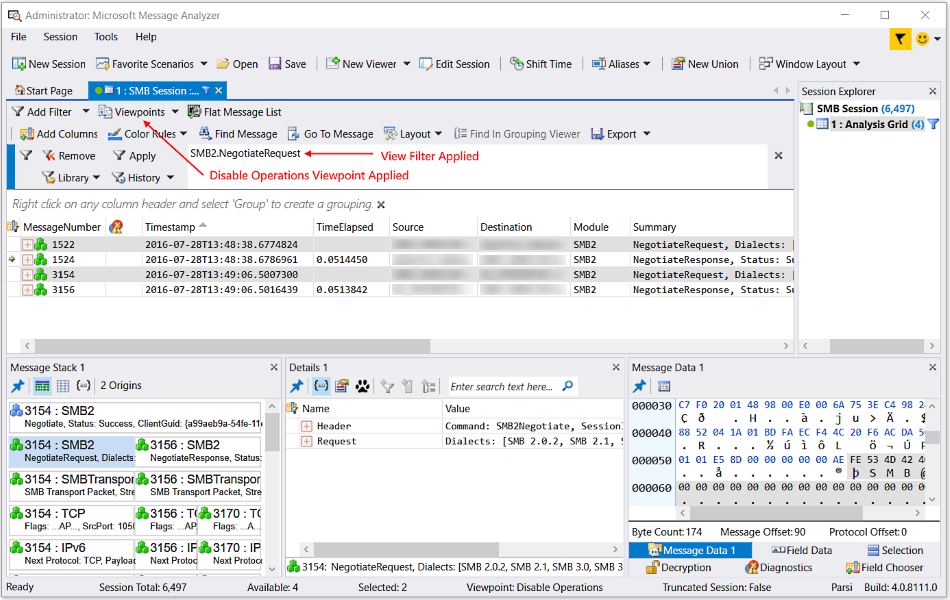
Figure 58: Disable Operations fails to isolate SMB2 request messages
Open a Viewpoint Filter panel by clicking the Add Viewpoint Filter command in the Add Filter drop-down list on the Filtering Toolbar.
Enter the
SMB2.NegotiateRequestfilter code in the Filter Expression text box of the Viewpoint Filter panel and then click the Apply button on the panel.Message Analyzer now shows only the SMB2 request messages in the Analysis Grid viewer, as shown in the following figure.
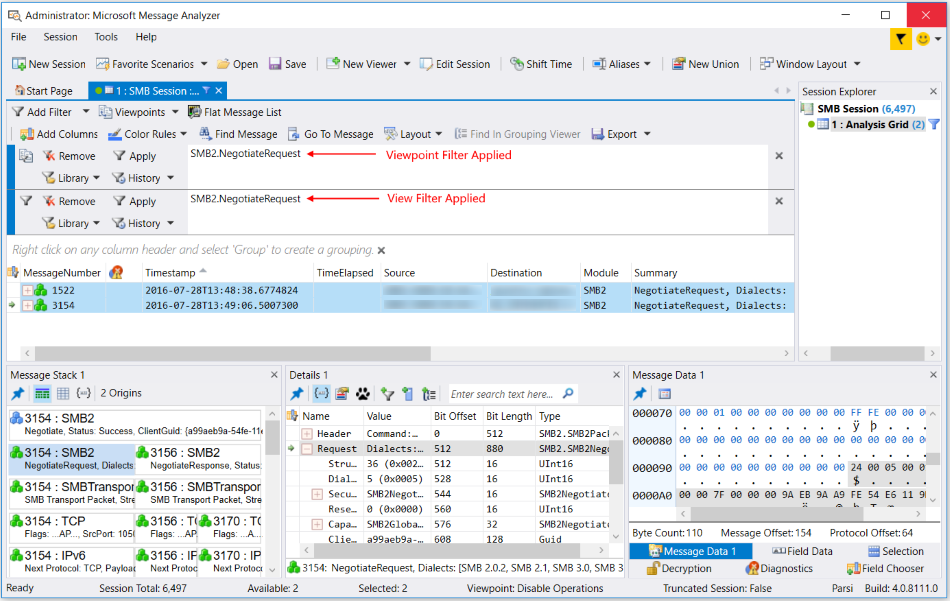
Figure 59: Viewpoint filter succeeds in isolating SMB2 request messages
As a rule of thumb, keep in mind that you can successfully filter under an applied Viewpoint only by applying a Viewpoint Filter, as a view Filter will not provide the desired results in this scenario.
Tip
In the previous procedure, you can substitute selection of the SMB/SMB2 Disable Operations command in the Viewpoints drop-down list for step 4.
Usage Scenarios with Viewpoints
In a typical usage scenario, you might select the Disable Operations Viewpoint in the Viewpoints drop-down list to cause Operations to be broken apart and the constituent request and response message pairs to then be displayed in chronological order, as previously described. In this display configuration, you might lose some context as the request and response messages will no longer be grouped together as a single operation, but will instead assume their original chronological position in the trace before Message Analyzer created the Operation nodes. This produces a view that is similar to Network Monitor and may provide some analytical value and familiarity to Network Monitor users, but the response messages can still be difficult to locate. However, you might find it easier to correlate the messages if you select the No Viewpoints item in the Viewpoints drop-down list to return to the display configuration that collapses all related request and response message pairs back into separate, top-level Operation nodes in the Analysis Grid viewer.
As an example of another usage scenario, you may have applied a viewpoint such as the HTTP Viewpoint during an Analysis Session because you want to view only the messages at that level. However, HTTP can also have non-operational messages that display at the applied Viewpoint, for example payload reassembly messages, and you might not want to examine these yet. To remove these non-operational messages, you can apply the view FilterHTTP && *IsOperation from the Filtering Toolbar. If you want to examine only the non-operational HTTP messages, apply the view FilterHTTP && !*IsOperation from another Filter panel on the Filtering Toolbar. You can then toggle back and forth between applying and removing these filters to view and analyze the Operation messages and non-Operation messages in the Analysis Grid viewer, as required.
Tip
After you select the Disable Operations Viewpoint to disassociate the request/response pairs in the Operation nodes for a set of trace results, you can continue to view the request and response message stacks side-by-side in the Message Stack Tool Window.
See Also
Using the Filtering Toolbar
Applying and Managing Viewpoints