顯現資料
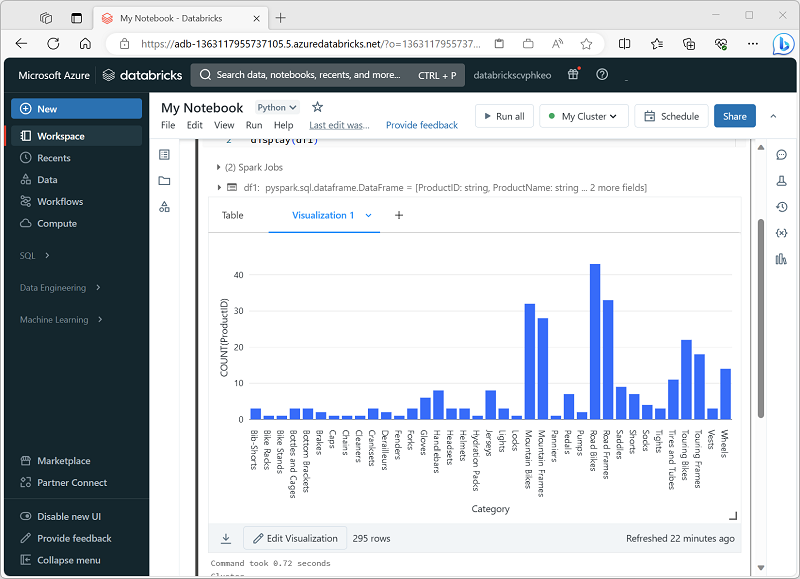
分析資料查詢結果最直覺的方式之一,就是以圖表形式視覺化。 Azure Databricks 中的筆記本在使用者介面中提供圖表製作功能,如果這項功能無法提供您需要的內容,您可以使用任何一個 Python 圖形庫,在筆記本中建立及顯示資料視覺效果。
使用內建筆記本圖表
在 Azure Databricks 的 Spark 筆記本中顯示資料框架或執行 SQL 查詢時,結果會顯示在程式碼儲存格底下。 根據預設,結果會轉譯為資料表,但您也可以將結果視覺化進行檢視,並自訂圖表顯示資料的方式,如下所示:

當您想要以視覺化方式快速摘要資料時,筆記本中的內建視覺效果功能會很有用。 當您想更充分掌控設定資料格式的方式,或顯示已在查詢中彙總的值時,應考慮使用圖形套件來建立您專屬的視覺效果。
在程式碼中使用圖形套件
有許多圖形套件可用來在程式碼中建立資料視覺效果。 特別是 Python 支援大量套件選項;大部分都是以基底 Matplotlib 程式庫為基礎。 圖形庫的輸出可以在筆記本中轉譯,方便結合用於擷取和操作資料的程式碼與內嵌資料視覺效果和 Markdown 資料格,以提供註解。
例如,您可以使用下列 PySpark 程式碼,從先前在本課程模組中探索的假設產品資料彙總資料,並使用 Matplotlib 從彙總的資料建立圖表。
from matplotlib import pyplot as plt

# Get the data as a Pandas dataframe
data = spark.sql("SELECT Category, COUNT(ProductID) AS ProductCount \
                  FROM products \
                  GROUP BY Category \
                  ORDER BY Category").toPandas()

# Clear the plot area
plt.clf()

# Create a Figure
fig = plt.figure(figsize=(12,8))

# Create a bar plot of product counts by category
plt.bar(x=data['Category'], height=data['ProductCount'], color='orange')

# Customize the chart
plt.title('Product Counts by Category')
plt.xlabel('Category')
plt.ylabel('Products')
plt.grid(color='#95a5a6', linestyle='--', linewidth=2, axis='y', alpha=0.7)
plt.xticks(rotation=70)

# Show the plot area
plt.show()
Matplotlib 程式庫要求資料使用 Pandas 資料框架而非 Spark 資料框架,因此 toPandas 方法可用來轉換資料框架。 接著程式碼會建立具有指定大小的圖表,並用一些自訂屬性設定繪製橫條圖,再顯示繪圖結果。
程式碼所產生的圖表看起來會類似下圖:

您可以使用 Matplotlib 程式庫來建立多種圖表;或者也可依偏好使用其他程式庫 (例如 Seaborn) 來建立高度自訂的圖表。
注意
視叢集的 Databricks Runtime 而定,Matplotlib 和 Seaborn 程式庫可能已經安裝在 Databricks 叢集上。 如果沒有,或您想要使用尚未安裝的不同程式庫,您可以將其新增至叢集。 如需詳細資料,請參閱 Azure Databricks 文件中的叢集程式庫。