練習 - 識別 CPU 使用率偏高的機器
在此,您將撰寫 KQL 查詢,以從 Perf 資料表擷取及轉換資料,進而了解哪些機器已達到或接近其總計算容量,哪些機器未充分使用。
1. 設定目標
若要解決效能問題、減輕潛在問題,並識別提高操作效率的機會,您應分析 IT 環境中的虛擬機器中央處理器 (CPU) 使用率。
若要識別與 CPU 相關的效能問題和提高效率的機會,您需要下列相關資訊:
- 每個使用中機器的 CPU 使用率趨勢。
- 機器在尖峰和無干擾時間的 CPU 使用率。
2. 評估記錄
Windows 和 Linux 代理程式會將在受監視的機器上執行的硬體元件、作業系統和應用程式的效能計數器傳送至 Azure 監視器中的 Perf 資料表。
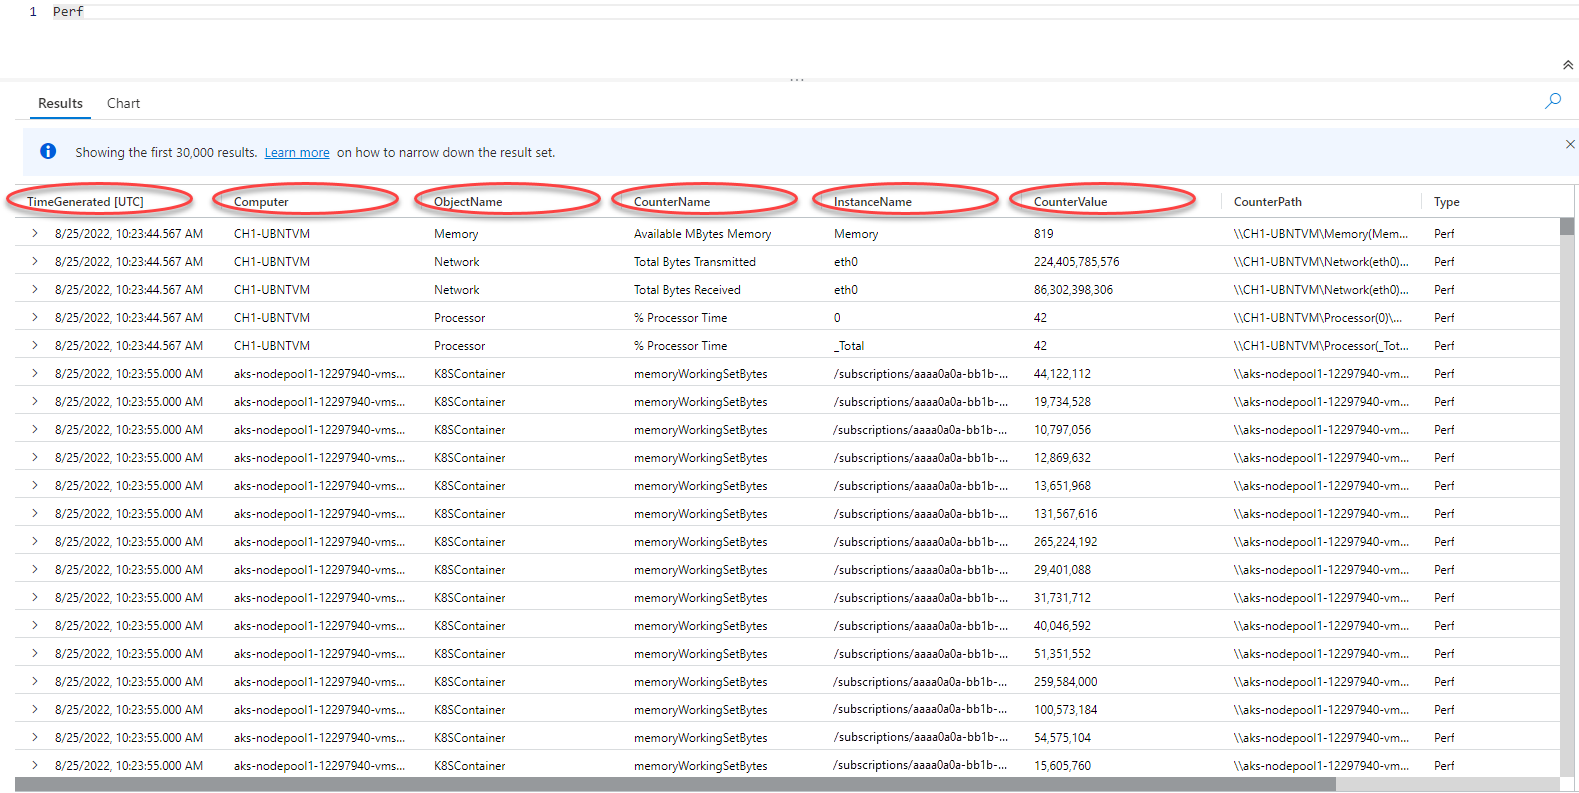
我們將對 Perf 資料表執行簡單的查詢,以擷取過去 24 小時的記錄,並了解資料表結構描述和資料表所保存的資料:
Perf  // The table you’re querying
| where TimeGenerated > ago(1d) // Filters for entries generated in the past day
您可以看到,TimeGenerated、Computer、ObjectName、CounterName、InstanceName 和 CounterValue 資料行保存了與我們的分析相關的資料。
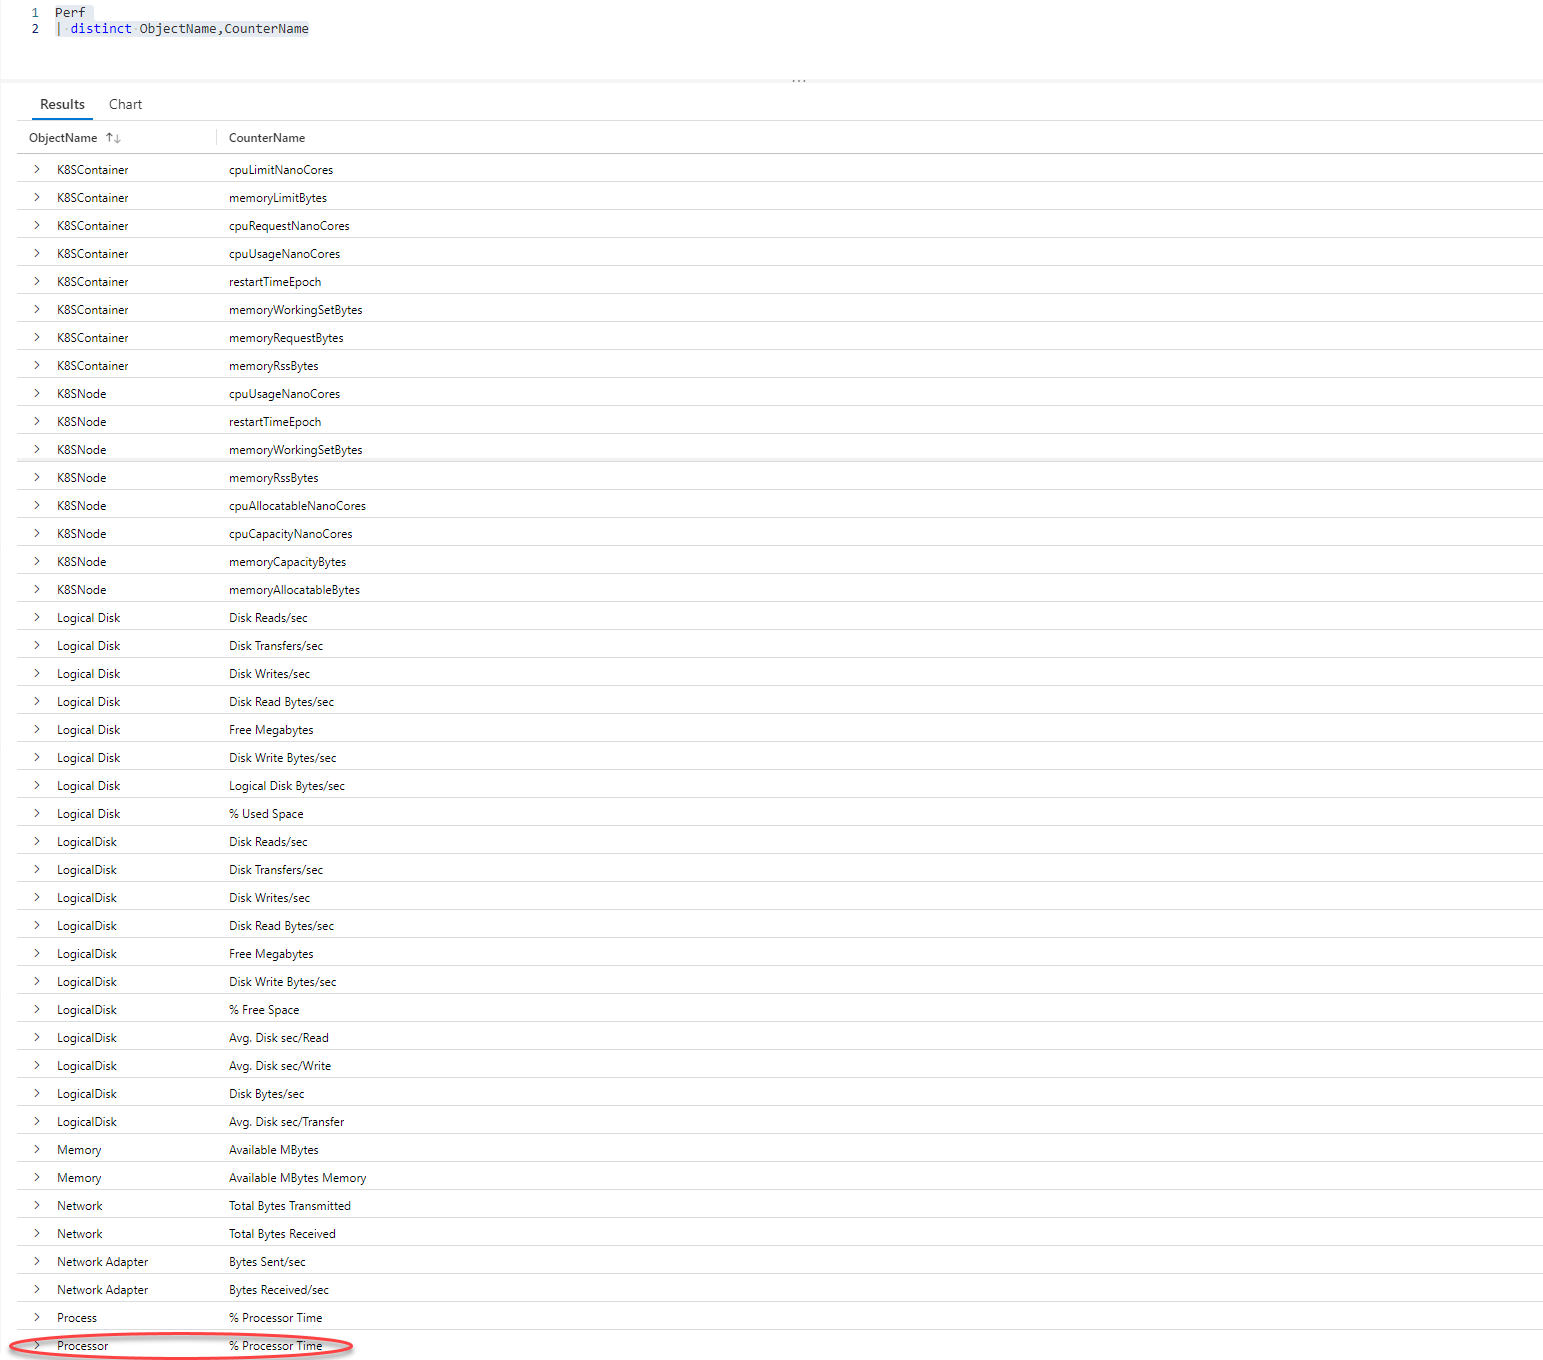
ObjectName 資料行列出 Azure 監視器從受監視的機器收集資料的所有物件的名稱。 CounterName 資料行保存 Azure 監視器所收集的各種效能計數器的名稱。 這兩個資料行都保存許多值,其中有許多值出現多次。 為了清楚查看這些資料行中的相異值,並判斷哪些計數器與目前的分析有關,我們將執行下列查詢:
Perf // The table you’re querying
| distinct ObjectName,CounterName // Lists distinct combinations of ObjectName and CounterName values
此螢幕擷取畫面顯示過去 24 小時內 CounterName 資料行中的 ObjectName 和 CounterName 值不同的組合:
% Processor Time 計數器可讓您了解處理器或中央處理器 (CPU) 的使用率。 這是您需要的資訊!
我們將評估如何使用這項資料,以及哪些 KQL 作業有助於擷取和轉換資料:
| 資料行 | 描述 | 分析目標 | 相關的 KQL 作業 |
|---|---|---|---|
TimeGenerated |
指出虛擬機器產生每個記錄的時機。 | 定義分析的時間範圍。 | where TimeGenerated > ago(1d) 如需詳細資訊,請參閱 ago()、where 運算子和數值運算子。 |
Computer |
從中收集事件的電腦。 | 將 CPU 使用率與特定電腦產生關聯。 | summarize... by Computer 如需詳細資訊,請參閱 summarize 運算子。 |
ObjectName |
保存所有以資料表保存效能資料的物件名稱。 | 監視處理器的效能。 | where ObjectName == "Processor" 如需詳細資訊,請參閱 == (等於) 運算子。 |
CounterName |
保存資料表中所有效能計數器的名稱。 | 監視 % Processor Time 效能計數器。 |
where CounterName == "% Processor Time" 如需詳細資訊,請參閱 where 運算子和 == (等於) 運算子。 |
InstanceName |
列出受監視物件的受監視執行個體。 | 監視所有處理器核心。 | where InstanceName == "_Total" 如需詳細資訊,請參閱 where 運算子和 == (等於) 運算子。 |
CounterValue |
為計數器收集的量值。 | 擷取 % Processor Time 效能計數器的效能量值。 |
summarize min(CounterValue), avg(CounterValue), max(CounterValue), percentiles(CounterValue, 90,99) 如需詳細資訊,請參閱 summarize 運算子以及 min()、max()、avg() 和 percentiles() 彙總函式。 |
3. 撰寫查詢
撰寫查詢,摘要說明所有機器在過去一天的平均、最小和最大 CPU 使用率。
擷取過去一天產生並報告
% Processor Time效能計數器的所有記錄:按一下以在 Log Analytics 示範環境中執行查詢。
Perf  // The table you’re querying
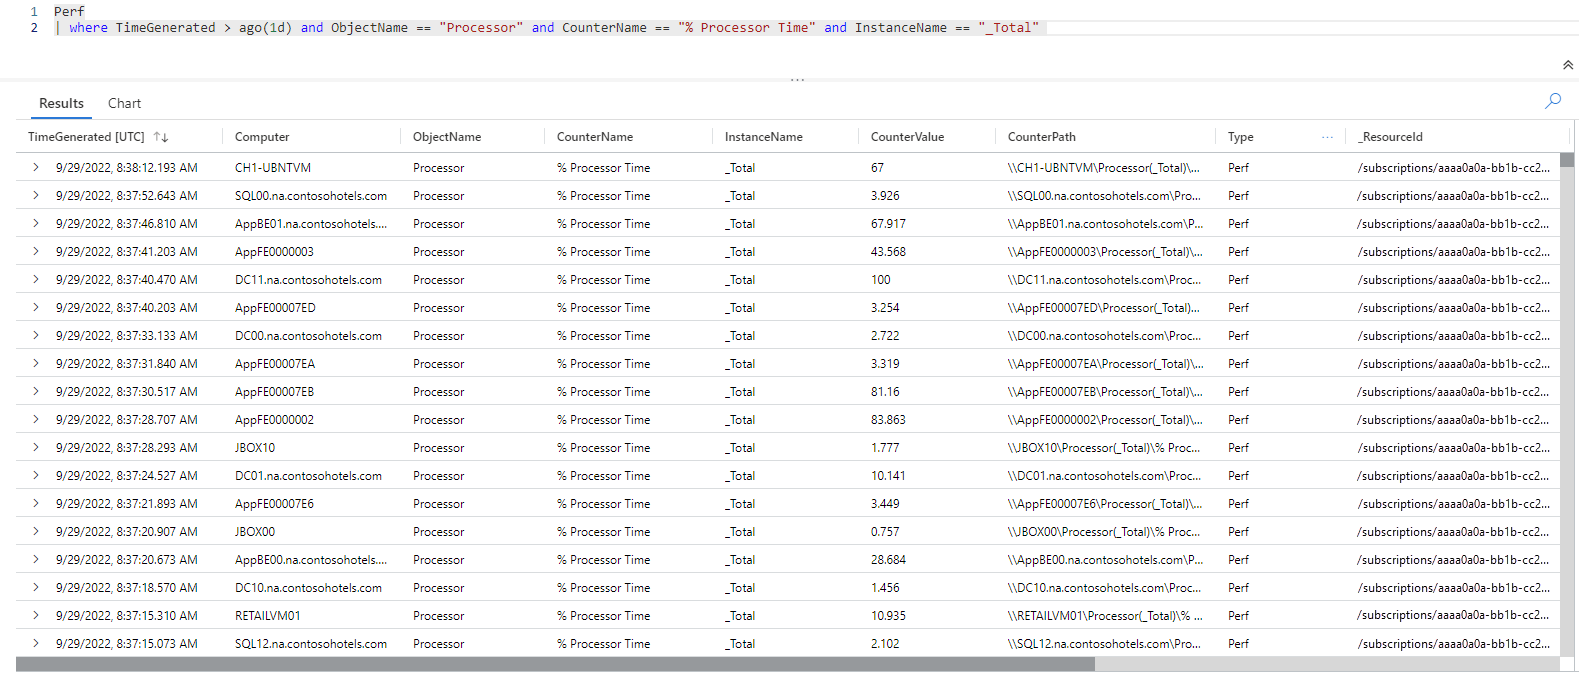
| where TimeGenerated > ago(1d) and ObjectName == "Processor" and CounterName == "% Processor Time" and InstanceName == "_Total" // Filters for entries generated in the past day related to total processor time measurements
此查詢會擷取與過去一天的總處理器時間量值有關的所有記錄。
尋找最小、最大和平均計數器值,並計算每部電腦的 90 個和第 99 個百分位數計數器值:
Perf  // The table you’re querying
| where TimeGenerated > ago(1d) and ObjectName == "Processor" and CounterName == "% Processor Time" and InstanceName == "_Total" // Filters for entries generated in the past day related to total processor time measurements
| summarize min(CounterValue), avg(CounterValue), max(CounterValue), percentiles(CounterValue, 90,99) by Computer // Presents the minimum, maximum, average, 90th and 99th percentile counter values for each computer
此查詢的結果集針對在您的 Log Analytics 工作區中有資料的每部電腦,顯示其最小、最大、平均、第 90 個和第 99 個百分位數
% Processor Time計數器值。在查詢結果中篩選出第 90 個和第 99 個百分位數範圍內的
% Processor Time計數器值高於 80 的項目:Perf // The table you’re querying | where TimeGenerated > ago(1d) and ObjectName == "Processor" and CounterName == "% Processor Time" and InstanceName == "_Total" // Filters for entries generated in the past day related to total processor time measurements | summarize min(CounterValue), avg(CounterValue), max(CounterValue), percentiles(CounterValue, 90,99) by Computer // Presents the minimum, maximum, average, 90th and 99th percentile counter values for each computer | where percentile_CounterValue_90 > 80 and percentile_CounterValue_99 > 80 // Filters previous query results for instances where the 90th and 99th percentile counters are higher than 80此查詢的結果集包含前 10% 和 15%
% Processor Time值超過 80 的所有電腦。
挑戰:將活動訊號資料表中的作業系統資訊新增至查詢結果
使用 join 運算子將不同資料表中的資訊與查詢結果相互關聯,往往可以進一步了解查詢結果。 如需詳細資訊,請參閱聯結運算子。
您是否可使用 join 運算子新增在每部電腦上執行之作業系統的相關資訊 (提供於 Heartbeat 資料表中),如第一個練習中所示?
解決方案:
從
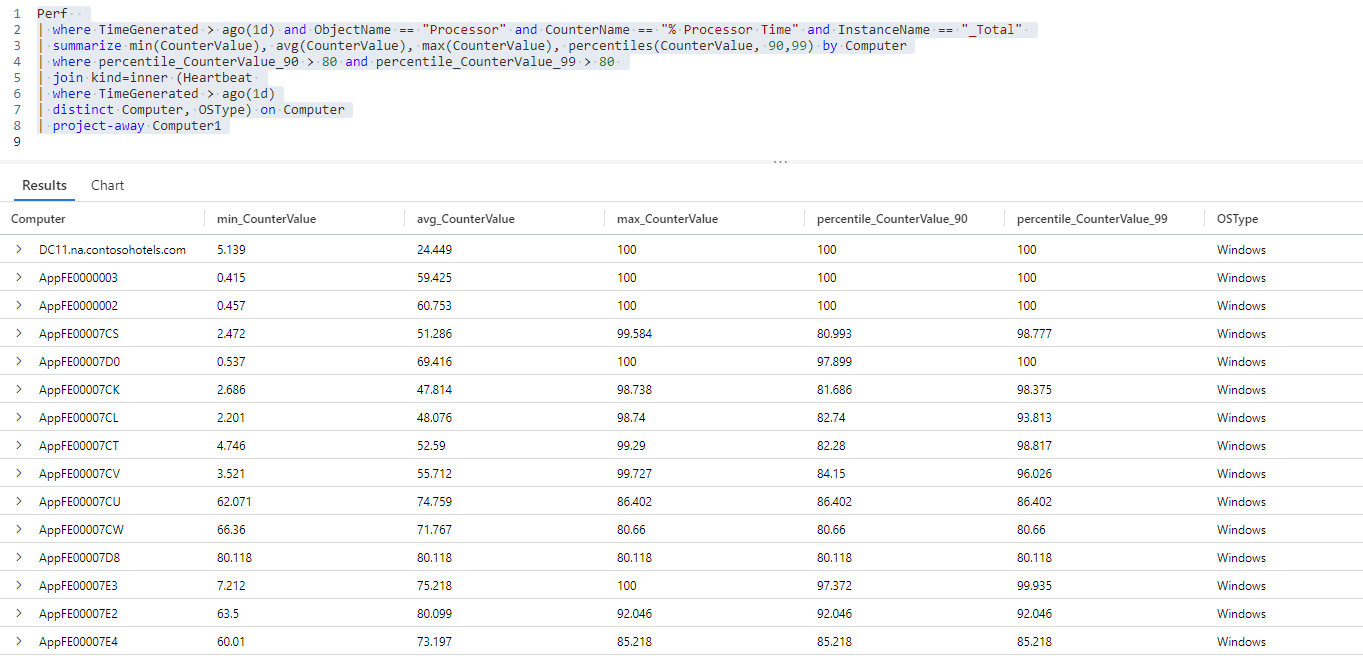
Heartbeat資料表新增關於查詢結果中每部電腦上執行之作業系統的資訊:Perf // The table you’re querying | where TimeGenerated > ago(1d) and ObjectName == "Processor" and CounterName == "% Processor Time" and InstanceName == "_Total" // Filters for entries generated in the past day related to total processor time measurements | summarize min(CounterValue), avg(CounterValue), max(CounterValue), percentiles(CounterValue, 90,99) by Computer // Presents the minimum, maximum, average, 90th and 99th percentile counter values for each computer | where percentile_CounterValue_90 > 80 and percentile_CounterValue_99 > 80 // Filters previous query results for instances where the 90th and 99th percentile counters are higher than 50 | join kind=inner (Heartbeat // Introduces data from the "Heartbeat" table to the previous query results | where TimeGenerated > ago(1d) // Time range for the data added from the "Heartbeat" table | distinct Computer, OSType) on Computer // Adds distinct combinations of computer and operating system查詢的這項反覆運算會將
Heartbeat資料表中的Computer和OSType資料行新增至先前的查詢結果。Computer資料行現在會在查詢結果中出現兩次 - 一次出現在Perf資料表的查詢,一次是Heartbeat資料表的查詢。Heartbeat資料表中的Computer資料行已重新命名為Computer1,但兩個資料表仍包含相同的資料。 同時有這兩個資料行可讓兩個資料表的結果相互關聯,但您現在可以篩選掉重複的資料行。從查詢結果中移除
Computer1資料行:Perf // The table you’re querying | where TimeGenerated > ago(1d) and ObjectName == "Processor" and CounterName == "% Processor Time" and InstanceName == "_Total" // Filters for entries generated in the past day related to total processor time measurements | summarize min(CounterValue), avg(CounterValue), max(CounterValue), percentiles(CounterValue, 90,99) by Computer // Presents the minimum, maximum, average, 90th and 99th percentile counter values for each computer | where percentile_CounterValue_90 > 80 and percentile_CounterValue_99 > 80 // Filters previous query results for instances where the 90th and 99th percentile counters are higher than 50 | join kind=inner (Heartbeat // Introduces data from the "Heartbeat" table to the previous query results | where TimeGenerated > ago(1d) // Time range for the data added from the "Heartbeat" table | distinct Computer, OSType) on Computer // Adds distinct combinations of computer and operating system | project-away Computer1 // Removes the "Computer1" column from the query results此查詢的結果集列出所有達到其完整 CPU 容量的電腦,以及每部電腦上執行的作業系統,這有助於進一步分析。


