練習 - 使用 Scikit Learn 執行線性迴歸
另一個廣泛用於研究社群的熱門 Python 程式庫是 scikit-learn,它擅長建置機器學習服務模型,用以協助從資料中擷取資訊。 在此練習中,您將使用 scikit-learn (其已在第 2 單元中匯入) 來計算 NASA 氣候資料的趨勢線。
將資料指標置於筆記本底部的空白資料格上。 將資料格類型變更為 [Markdown],並輸入 "Perform linear regression with scikit-learn" 作為文字。
新增 [程式碼] 資料格,然後貼上下列程式碼。
# Pick the Linear Regression model and instantiate it
model = LinearRegression(fit_intercept=True)

# Fit/build the model
model.fit(yearsBase[:, np.newaxis], meanBase)
mean_predicted = model.predict(yearsBase[:, np.newaxis])

# Generate a plot like the one in the previous exercise
plt.scatter(yearsBase, meanBase)
plt.plot(yearsBase, mean_predicted)
plt.title('scatter plot of mean temp difference vs year')
plt.xlabel('years', fontsize=12)
plt.ylabel('mean temp difference', fontsize=12)
plt.show()

print(' y = {0} * x + {1}'.format(model.coef_[0], model.intercept_))
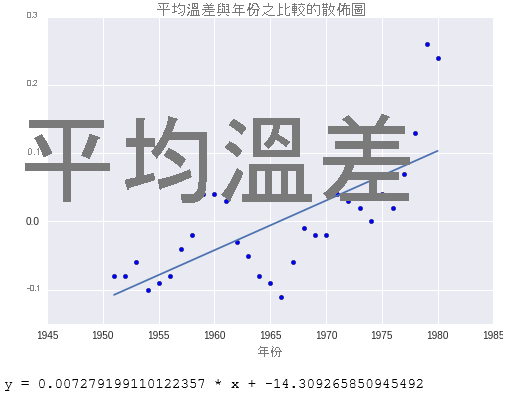
現在,執行資料格以顯示使用迴歸線的散佈圖。

「透過 sckikit-learn 計算且使用迴歸線的散佈圖」
此輸出與上一個練習中的輸出幾乎完全相同。 差別在於 scikit-learn 為您完成了更多工作。 具體來說,您不需要像使用 NumPy 那樣撰寫線條函式;scikit-learn 的 LinearRegression 函式可為您完成這項作業。 scikit-learn 支援「許多」不同類型的迴歸,這在建置複雜的機器學習服務模型時可能會派上用場。