練習 - 使用 Numpy 執行線性迴歸
散佈圖提供以視覺化方式呈現資料的便利方法,但假設您想要將散佈圖與顯示資料隨時間變化趨勢的趨勢線重疊。 計算這類趨勢線的其中一個方法是 Linear regression (線性迴歸)。 在此練習中,您將使用 NumPy 執行線性迴歸,並使用 Matplotlib 從資料繪製趨勢線。
將資料指標置於筆記本底部的空白資料格上。 將資料格類型變更為 [Markdown],並輸入 "Perform linear regression" 作為文字。
新增 [程式碼] 資料格,然後貼上下列程式碼。 請花一點時間閱讀註解 (開頭為 # 符號的行),以了解程式碼的功用。
# Creates a linear regression from the data points
m,b = np.polyfit(yearsBase, meanBase, 1)

# This is a simple y = mx + b line function
def f(x):
    return m*x + b

# This generates the same scatter plot as before, but adds a line plot using the function above
plt.scatter(yearsBase, meanBase)
plt.plot(yearsBase, f(yearsBase))
plt.title('scatter plot of mean temp difference vs year')
plt.xlabel('years', fontsize=12)
plt.ylabel('mean temp difference', fontsize=12)
plt.show()

# Prints text to the screen showing the computed values of m and b
print(' y = {0} * x + {1}'.format(m, b))
plt.show()
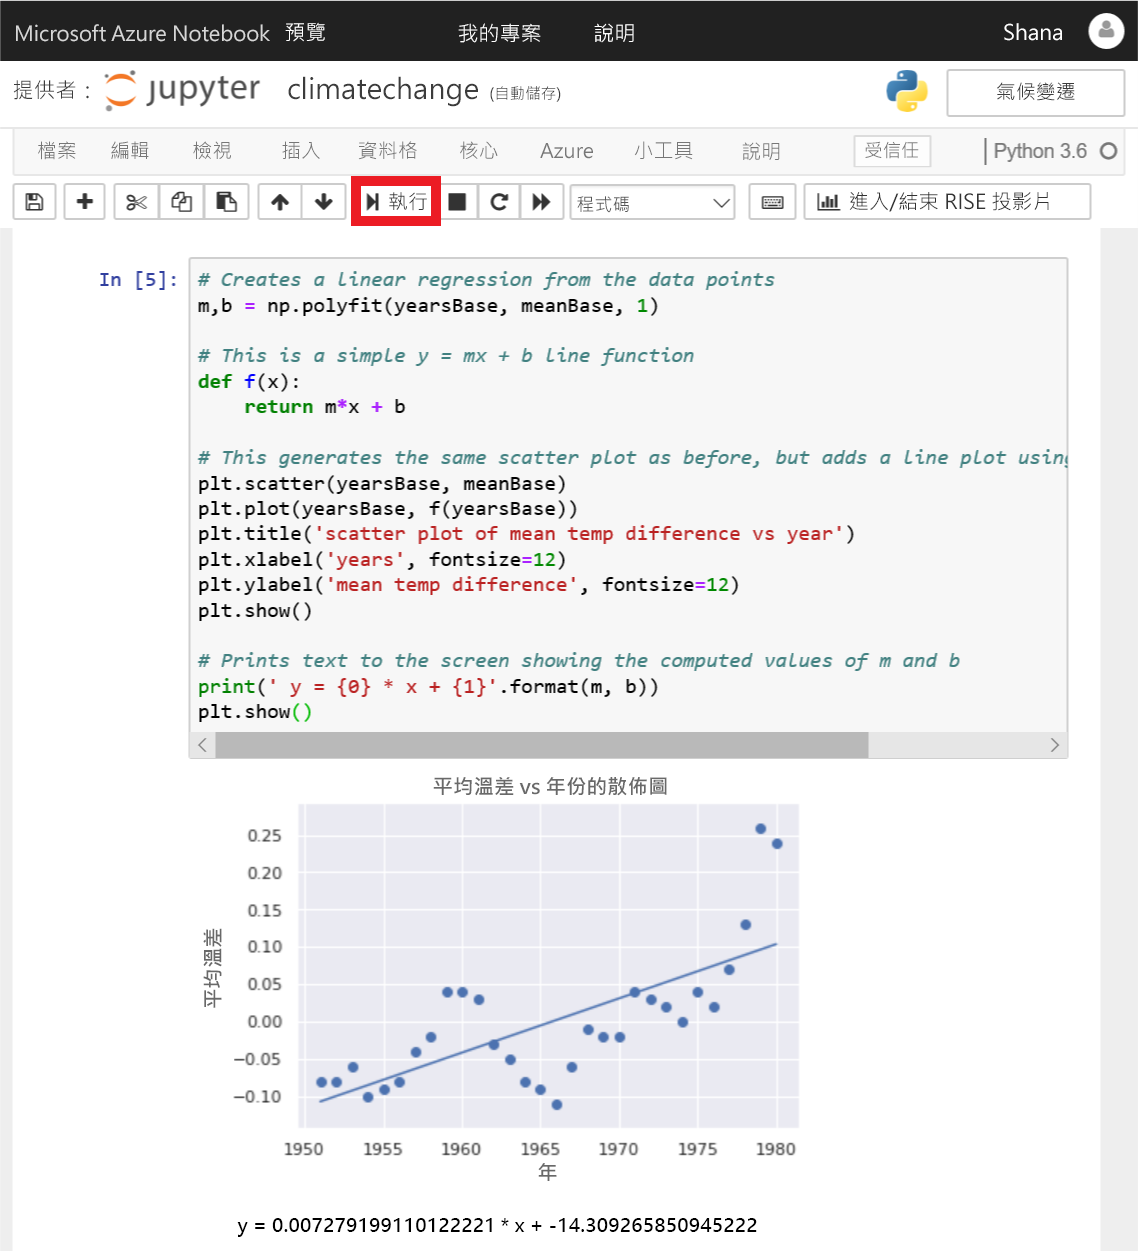
現在,執行資料格以顯示使用迴歸線的散佈圖。

使用迴歸線的散佈圖
從迴歸線中,您可以看到 30 年平均溫度及 5 年平均溫度之間的差異會隨著時間增加。 產生迴歸線所需大部分計算工作均由 NumPy 的 polyfit 函式完成,該函式會計算方程式 y = mx + b 中 m 和 b 的值。