Create and share paginated reports in the Power BI service
Important
This content is archived and is not being updated. For the latest documentation, go to What's new in Power BI?. For the latest release plans, go to Dynamics 365, Power Platform, and Cloud for Industry release plans.
| Enabled for | Public preview | General availability |
|---|---|---|
| Users, automatically |  Jul 31, 2023
 |
 Jul 31, 2023
 |
Business value
Create simple operational reports with low code, drag-and-drop experiences in the Power BI service on the web. You can share these in a variety of formats or just print them out!
Feature details
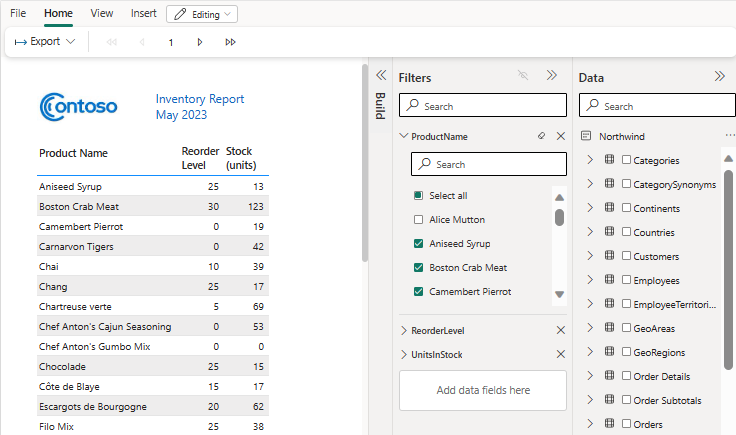
You can create a multitude of operational reports with our WYSIWG ("What you see is what you get") web-authoring experience.
For example, you can create a simple Inventory report by inserting an image, adding a title and a table. Simply filter the data you want in the table, reorder columns, display totals, and rename column headers.

See also
Create paginated reports that you can export in the Power BI service (docs)